Gas Demand
1. Country level sectoral split
The following maps display the annual gas demand on a country level basis. The size of the pie chart is representative of the volume of demand, with the sectoral share displayed as well as an indication if this volume is an increase or decrease when compared to the historic average (calculated from 2010 to 2016).
2020 – Best Estimate
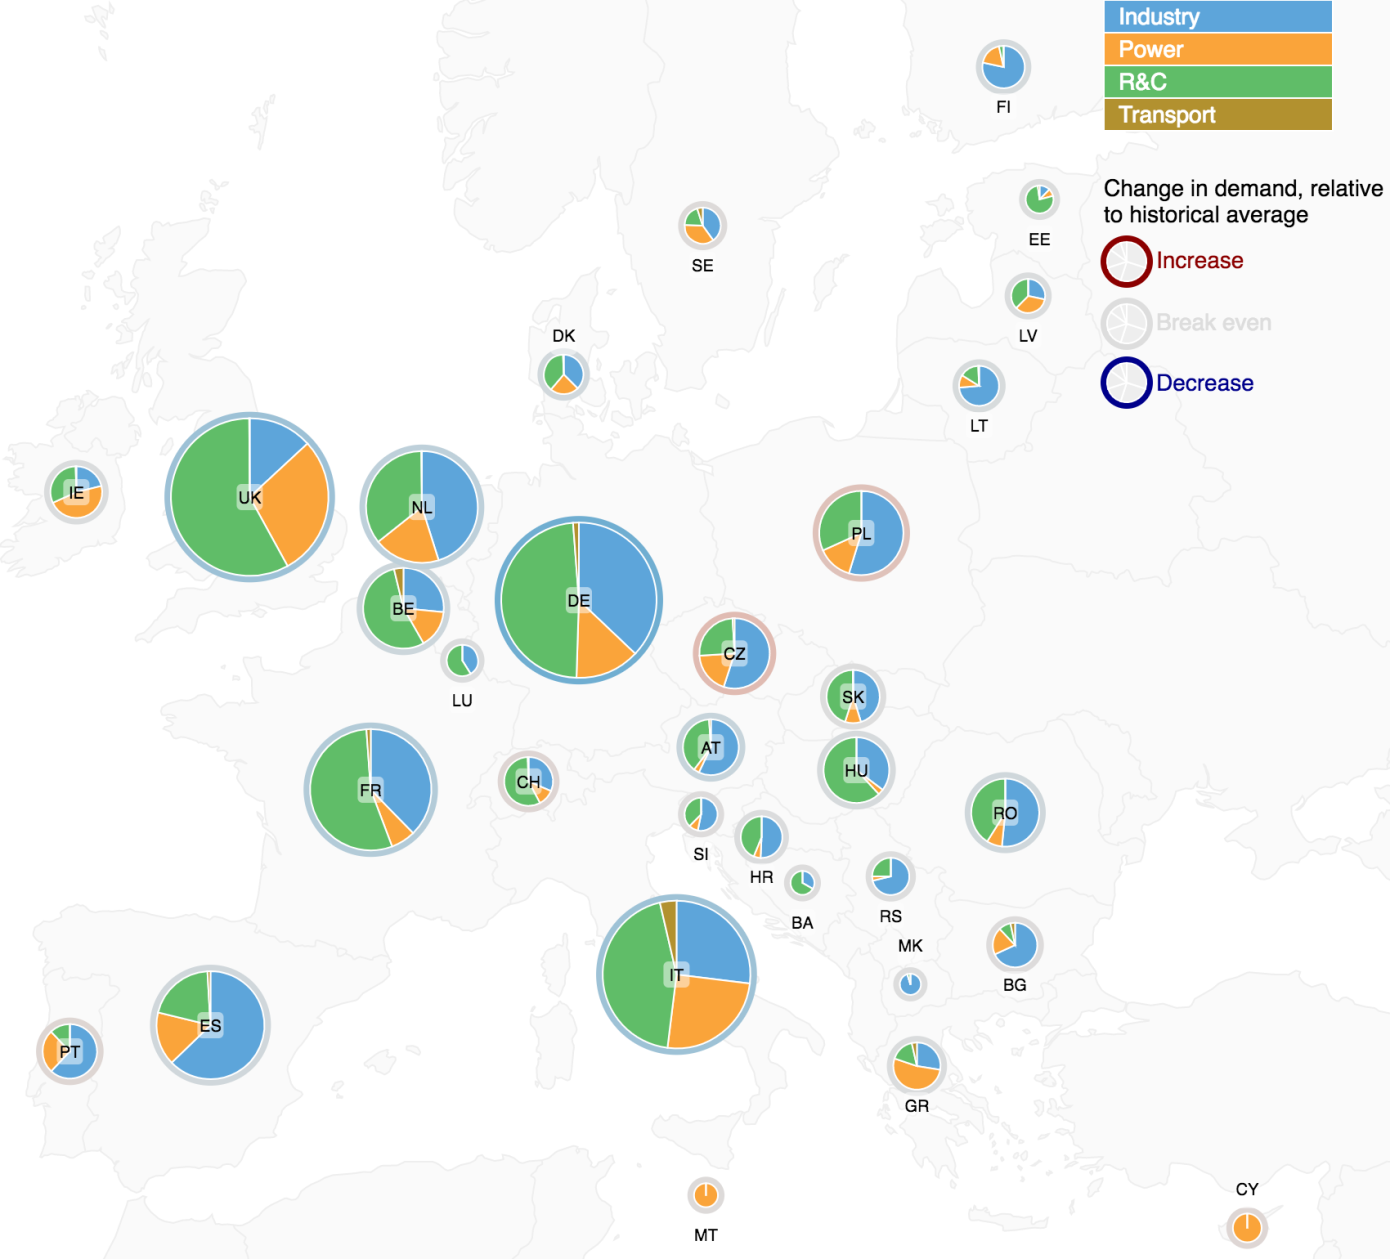
Figure 7: 2020 Best Estimate: Country level gas demand with sectoral split, with relative change to historic average
2025 – Coal Before Gas
 Figure 8: 2025 Best Estimate – coal before gas sensitivity: Country
level gas demand with sectoral split, with relative change to historic
average
Figure 8: 2025 Best Estimate – coal before gas sensitivity: Country
level gas demand with sectoral split, with relative change to historic
average
2025 – Gas Before Coal
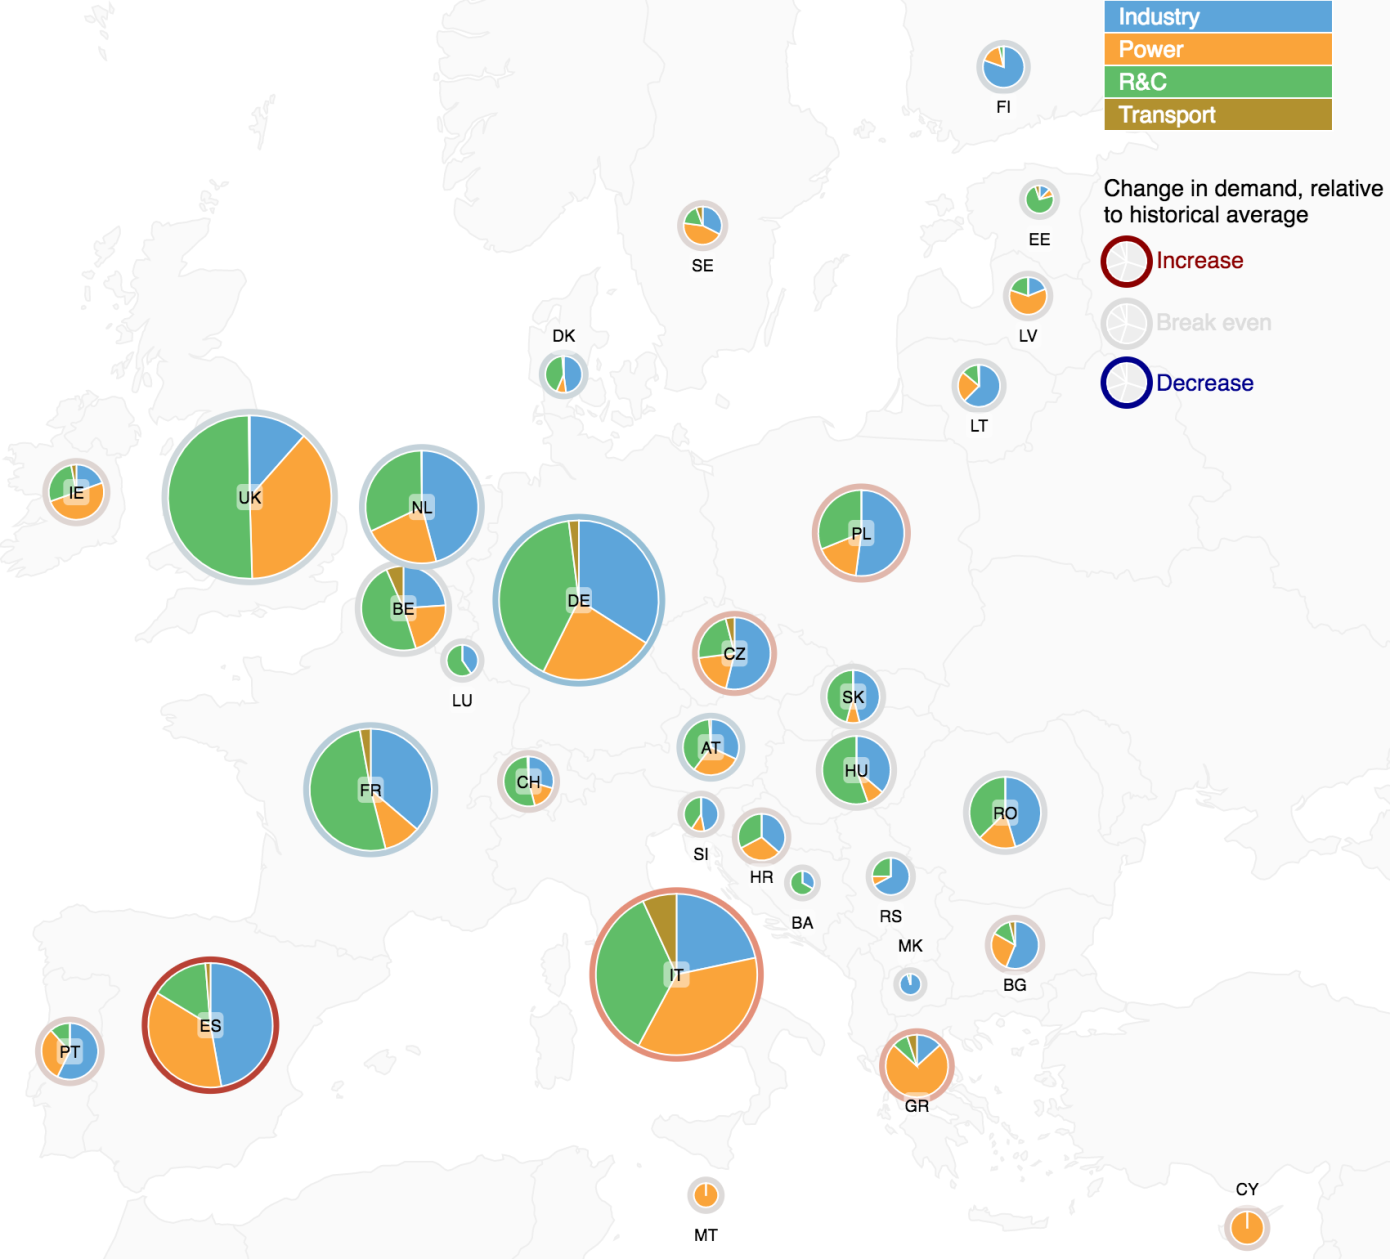
Figure 9: 2025 Best Estimate – gas before coal sensitivity: Country level gas demand with sectoral split, with relative change to historic average
2030 – Sustainable Transition
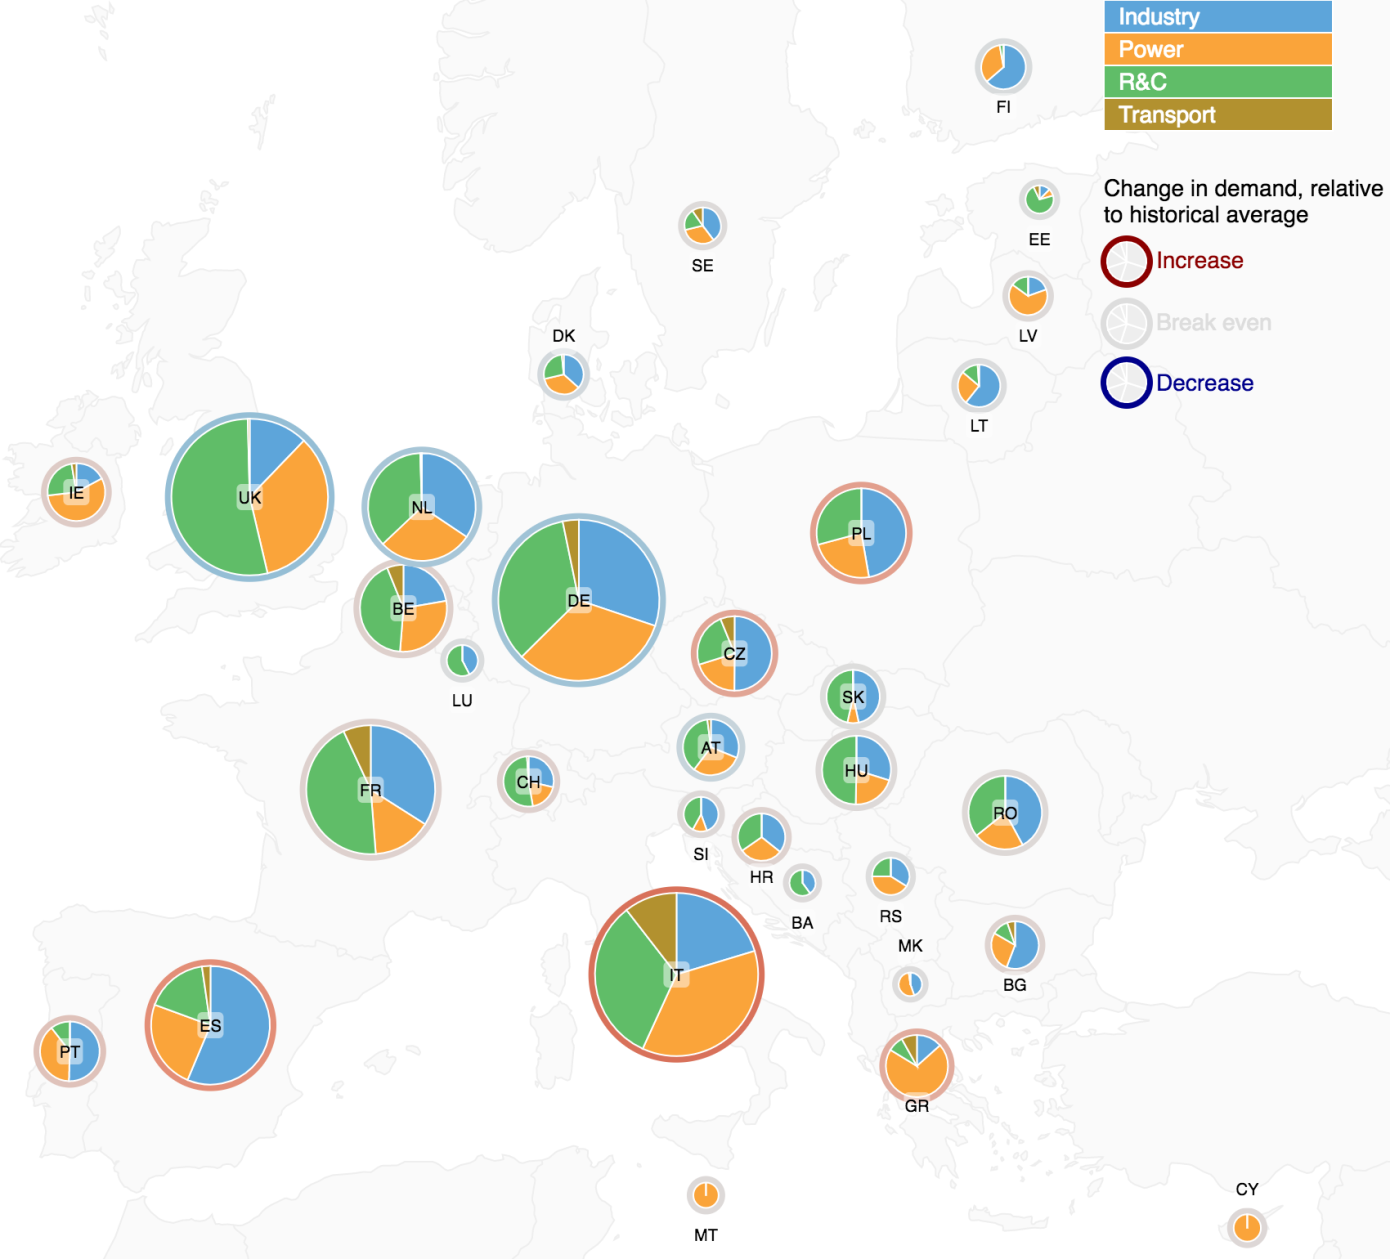
Figure 10: 2030 Sustainable Transition: Country level gas demand with sectoral split, with relative change to historic average
2030 – Distributed Generation
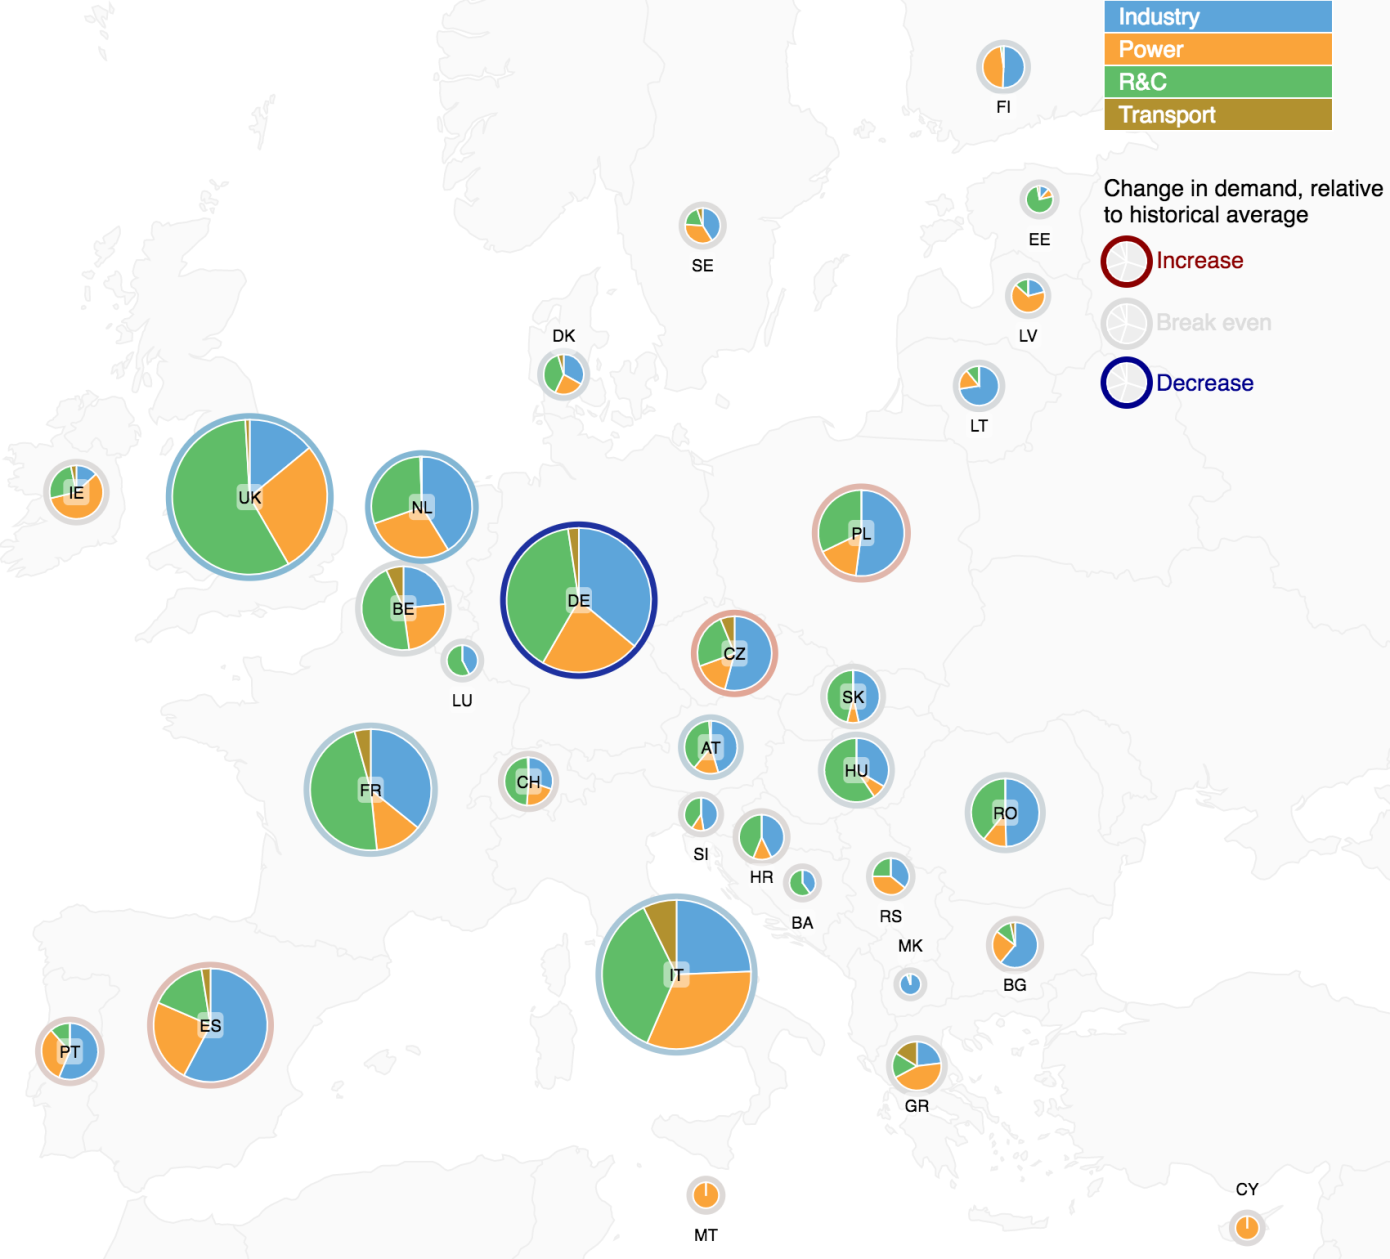
Figure 11: 2030 Distributed Generation: Country level gas demand with sectoral split, with relative change to historic average
2030 – External scenario based on EUCO30
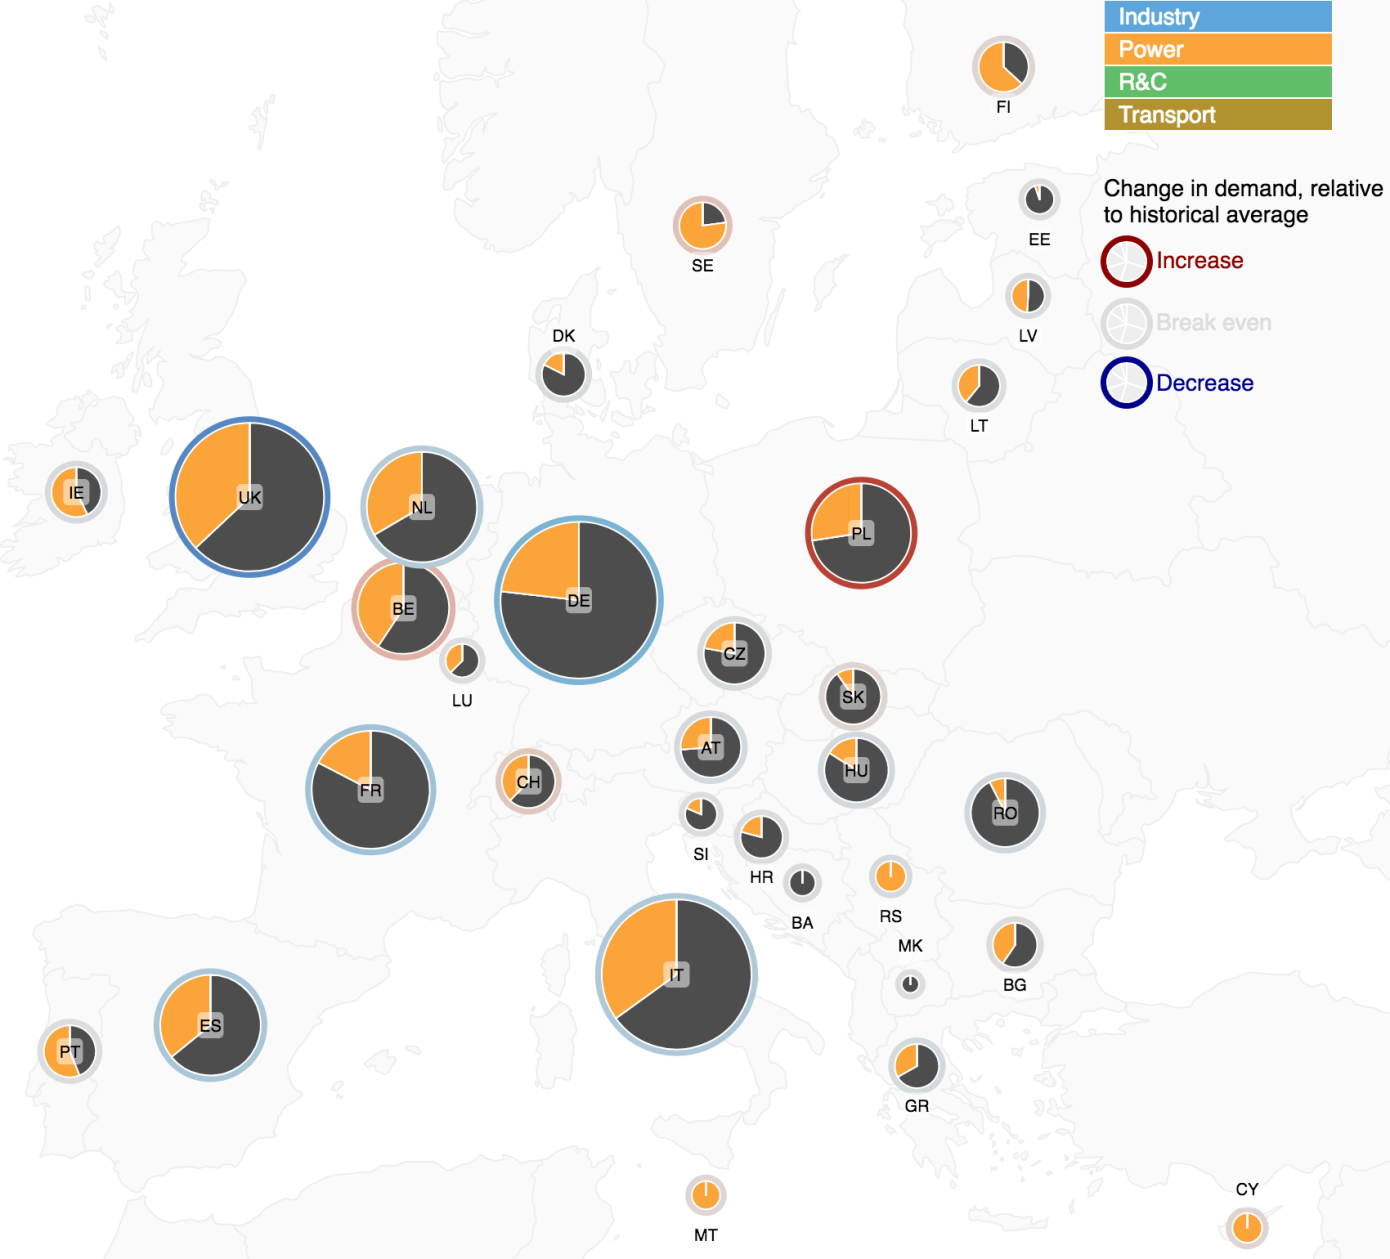
Figure 12: 2030 External Scenario based on EUCO30: Country level gas demand with sectoral split, with relative change to historic average
2040 – Sustainable Transition
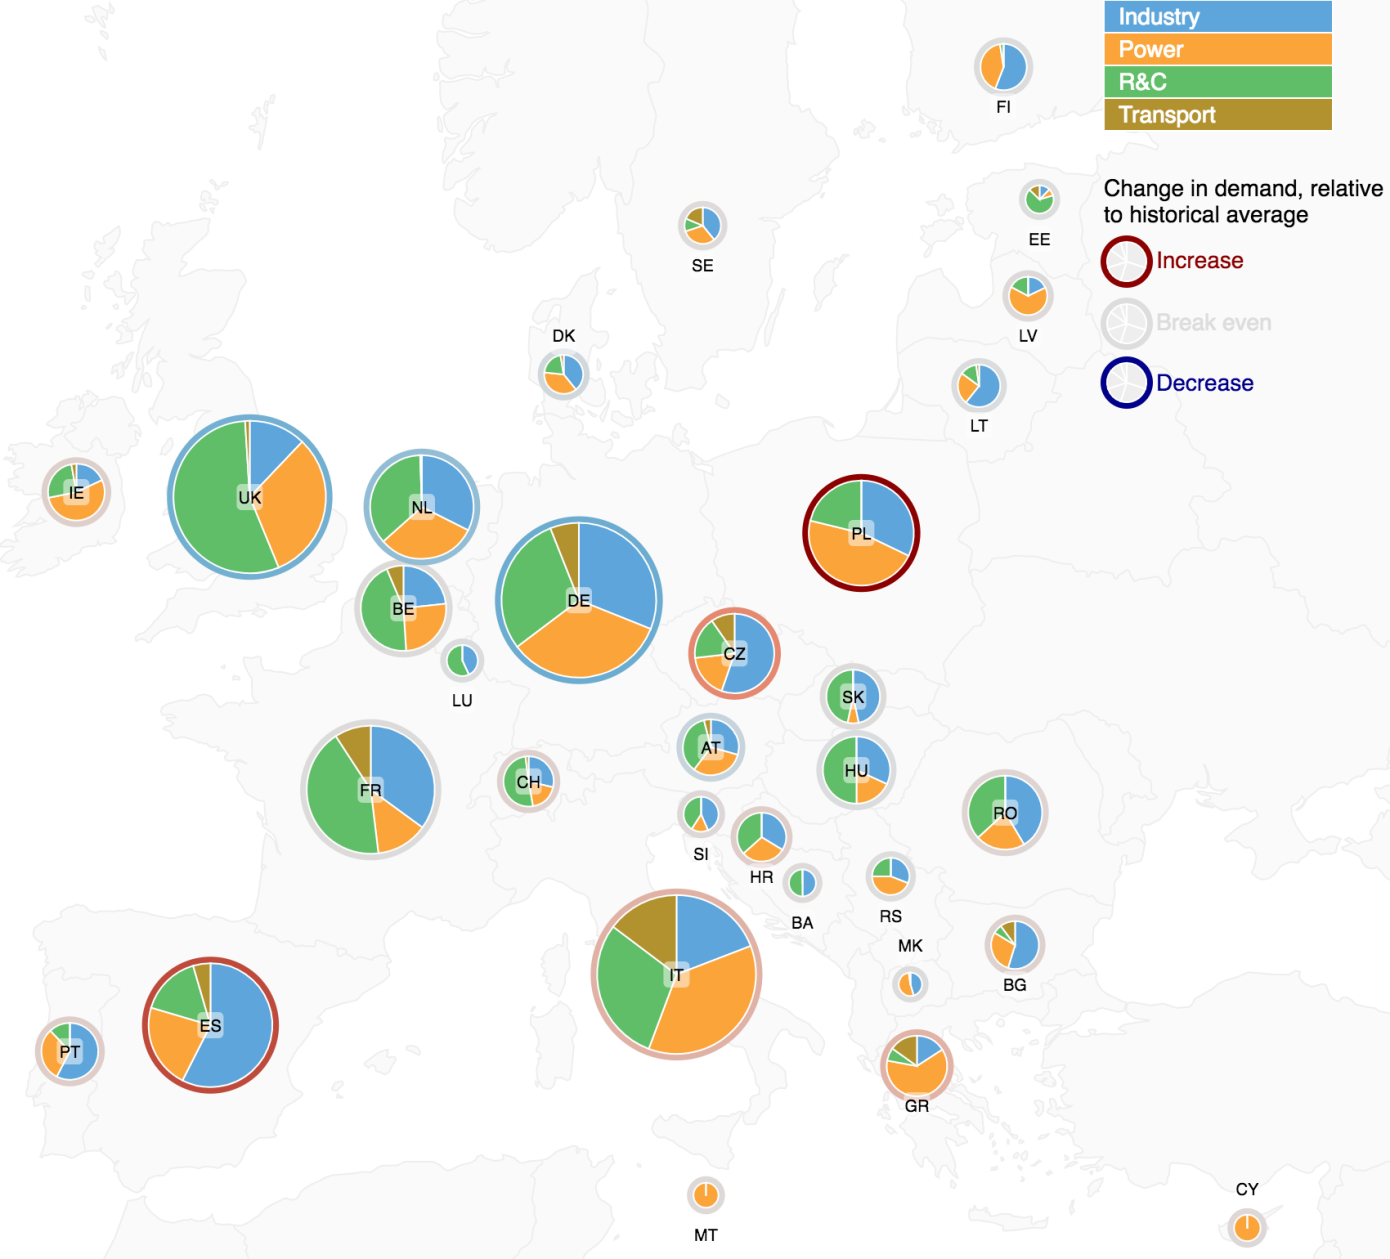
Figure 13: 2040 Sustainable Transition: Country level gas demand with sectoral split, with relative change to historic average
2040 – Distributed Generation
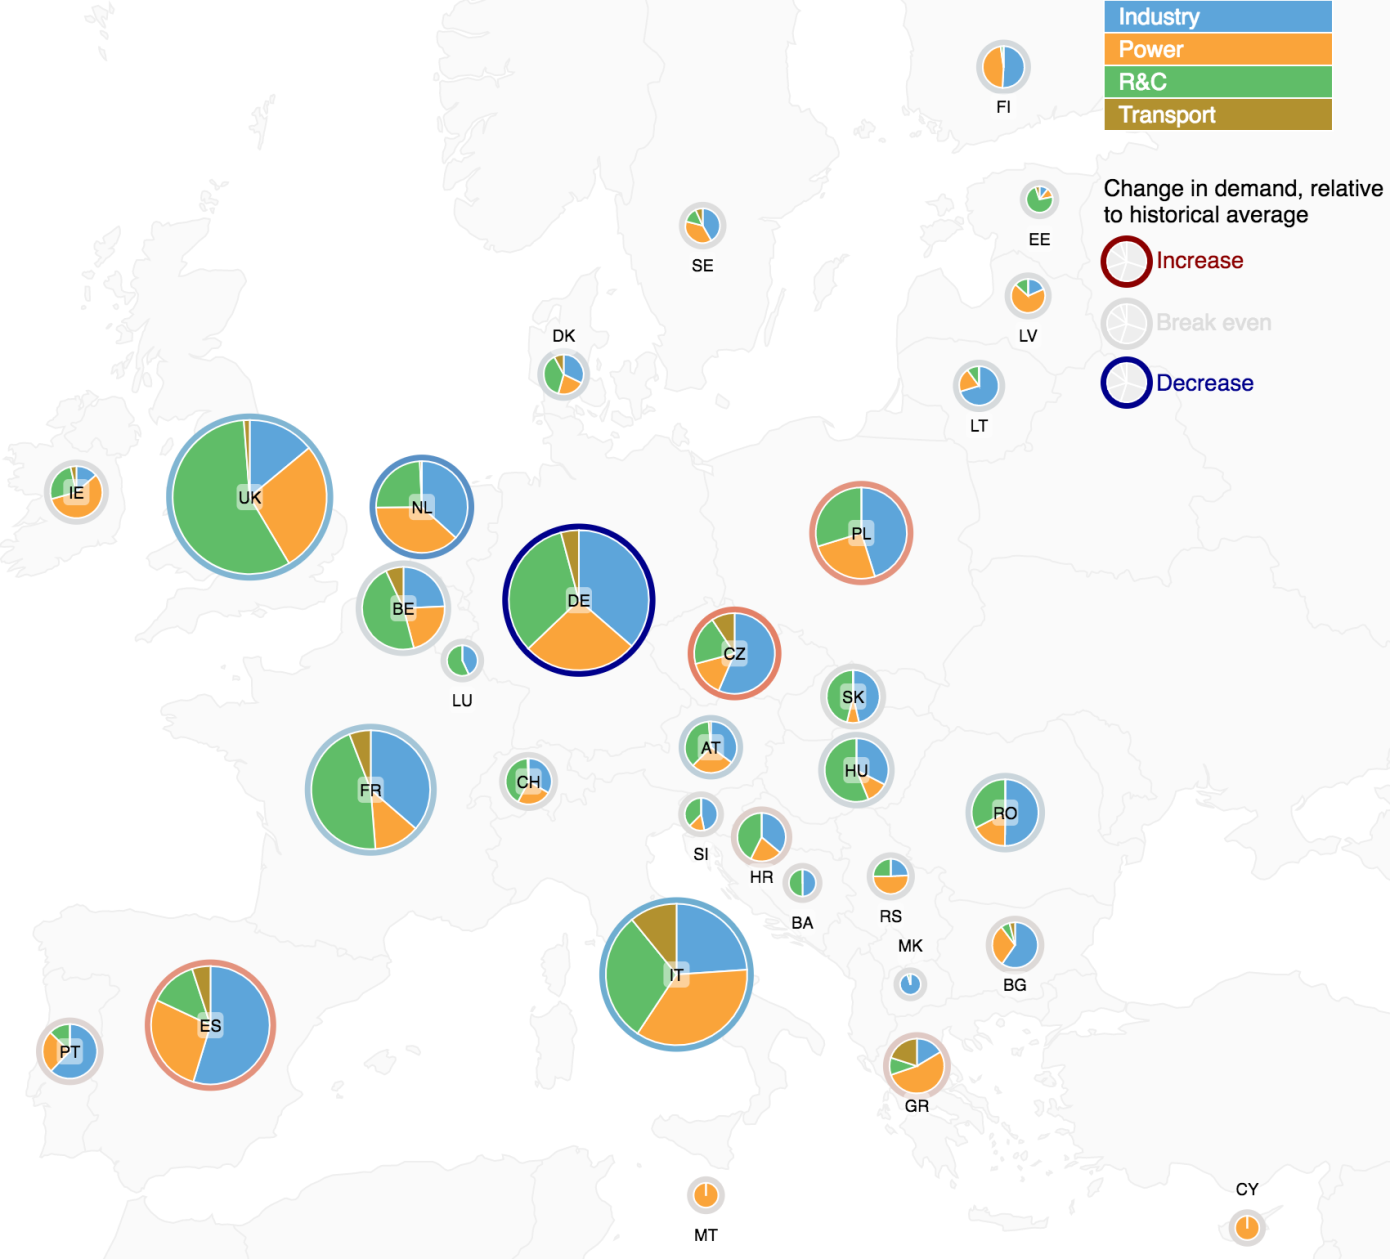
Figure 14: 2040 Distributed Generation: Country level gas demand with sectoral split, with relative change to historic average
2040 – Global Climate Action
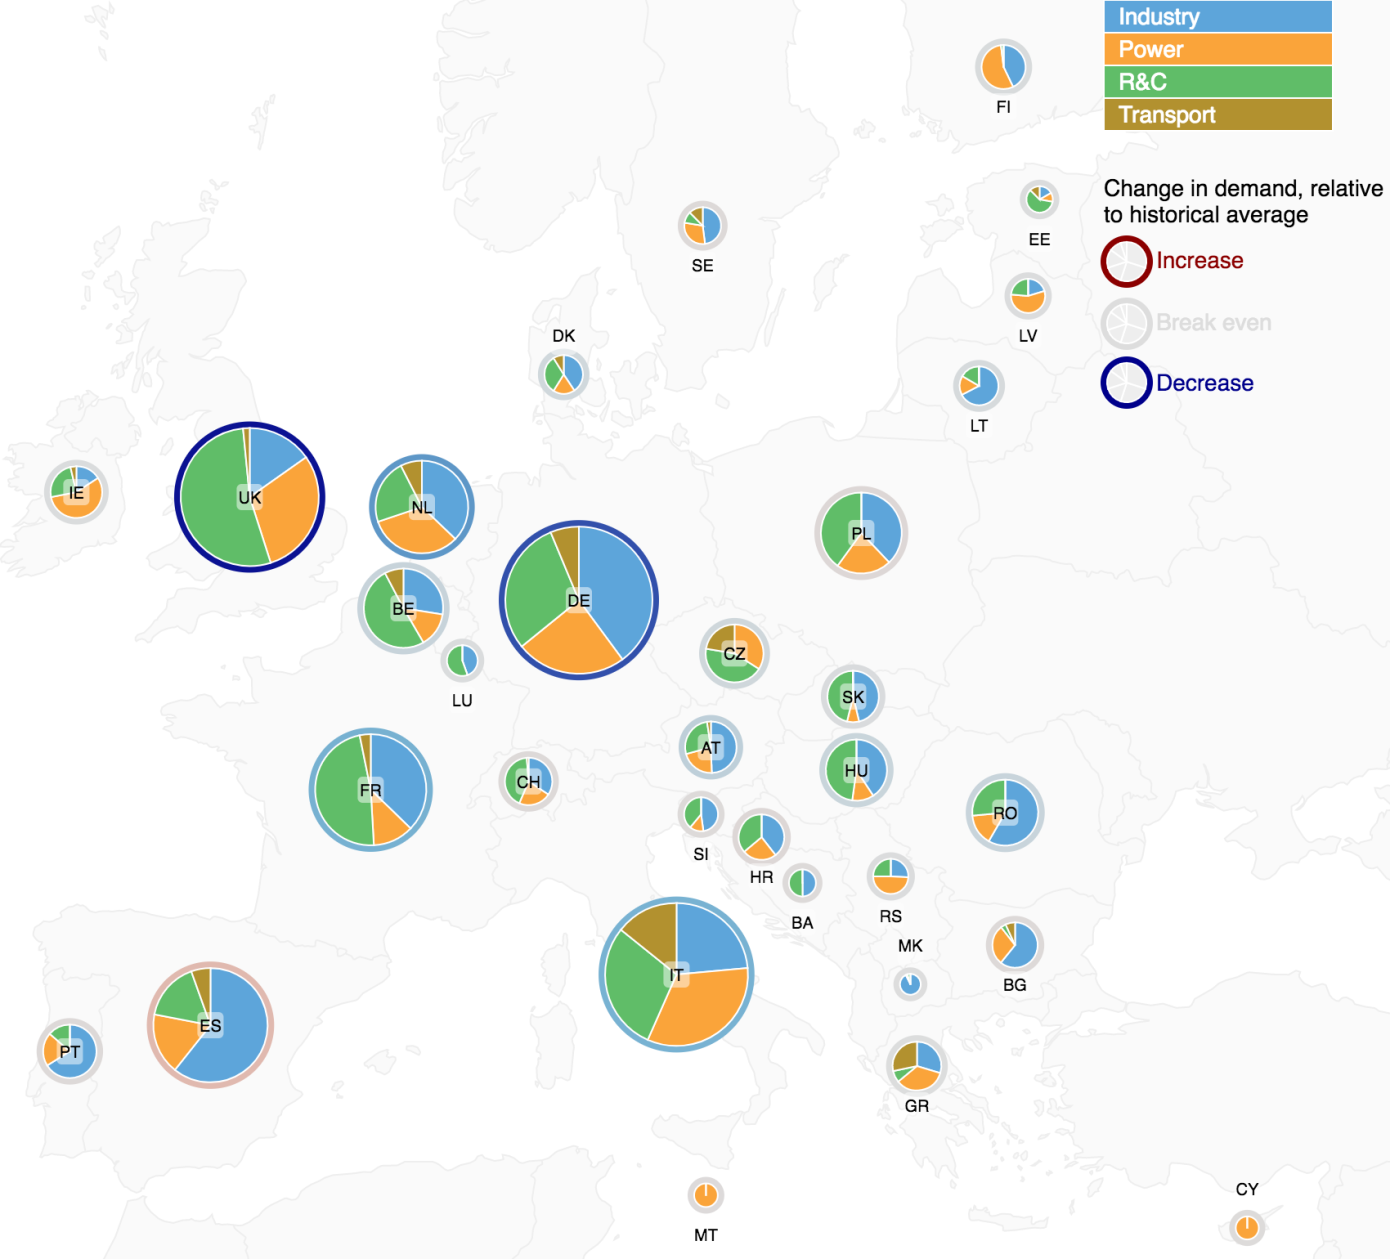
Figure 15: 2040 Global Climate Action: Country level gas demand with sectoral split, with relative change to historic average
- Gas High Demand Cases
The following charts show the high demand cases displayed by the 2 week and peak requirements, on a country level basis.
2020 – Best Estimate
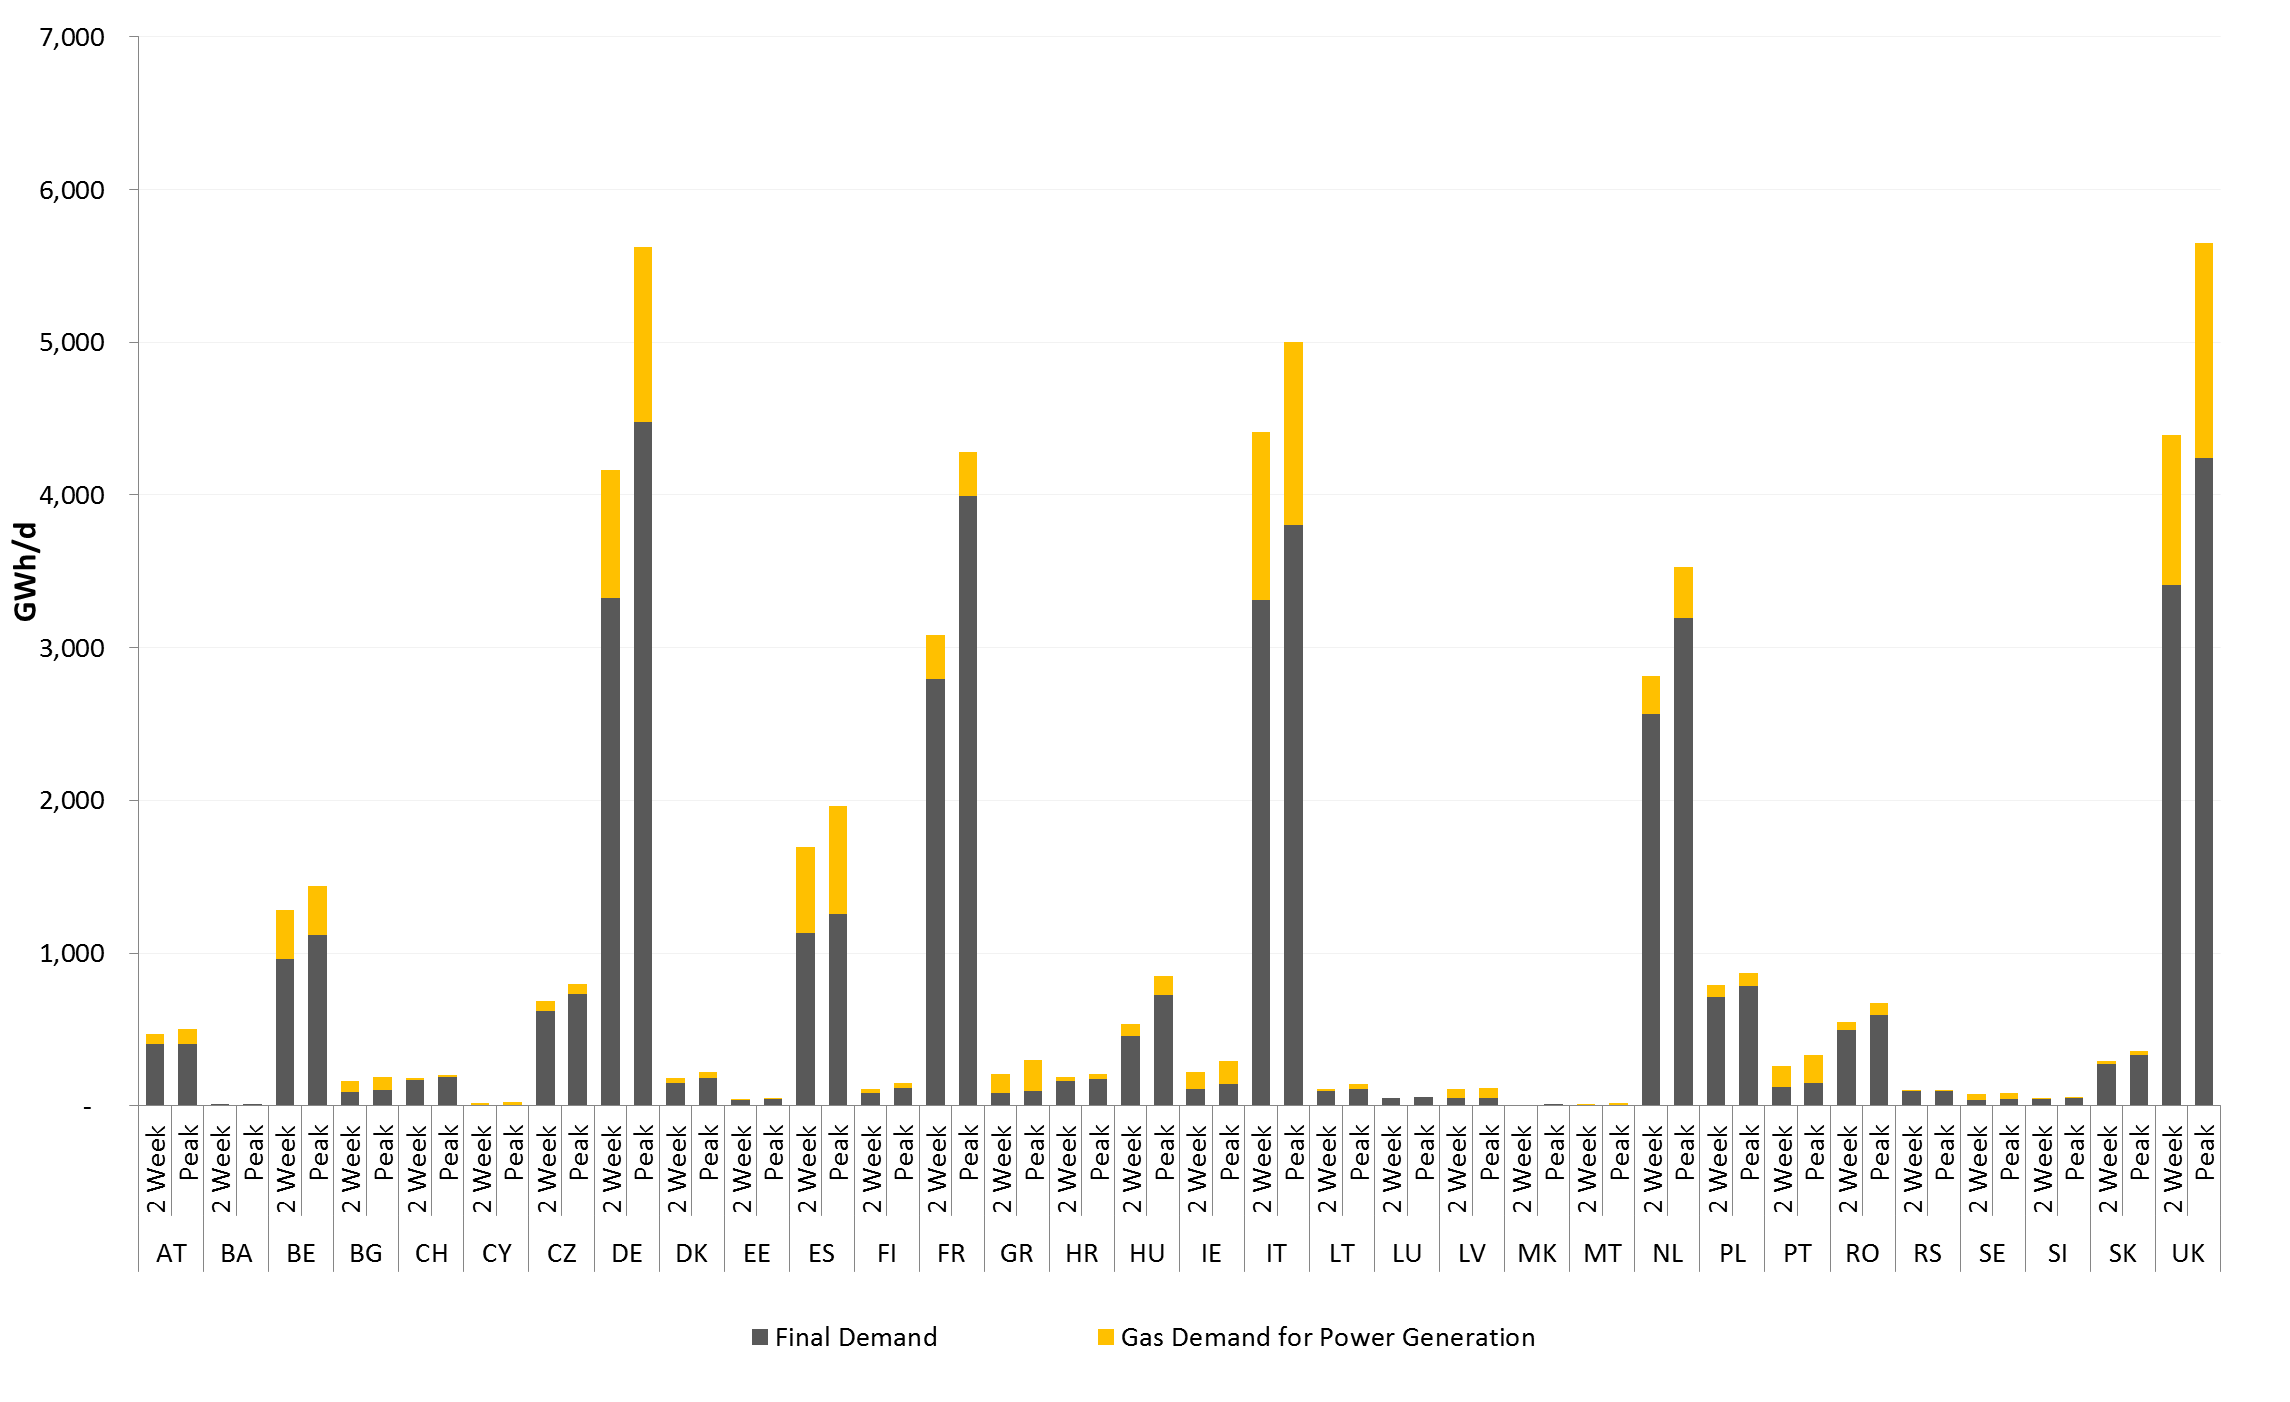
Figure 16: Gas high demand cases – 2020 Best Estimate
2025 – Coal Before Gas
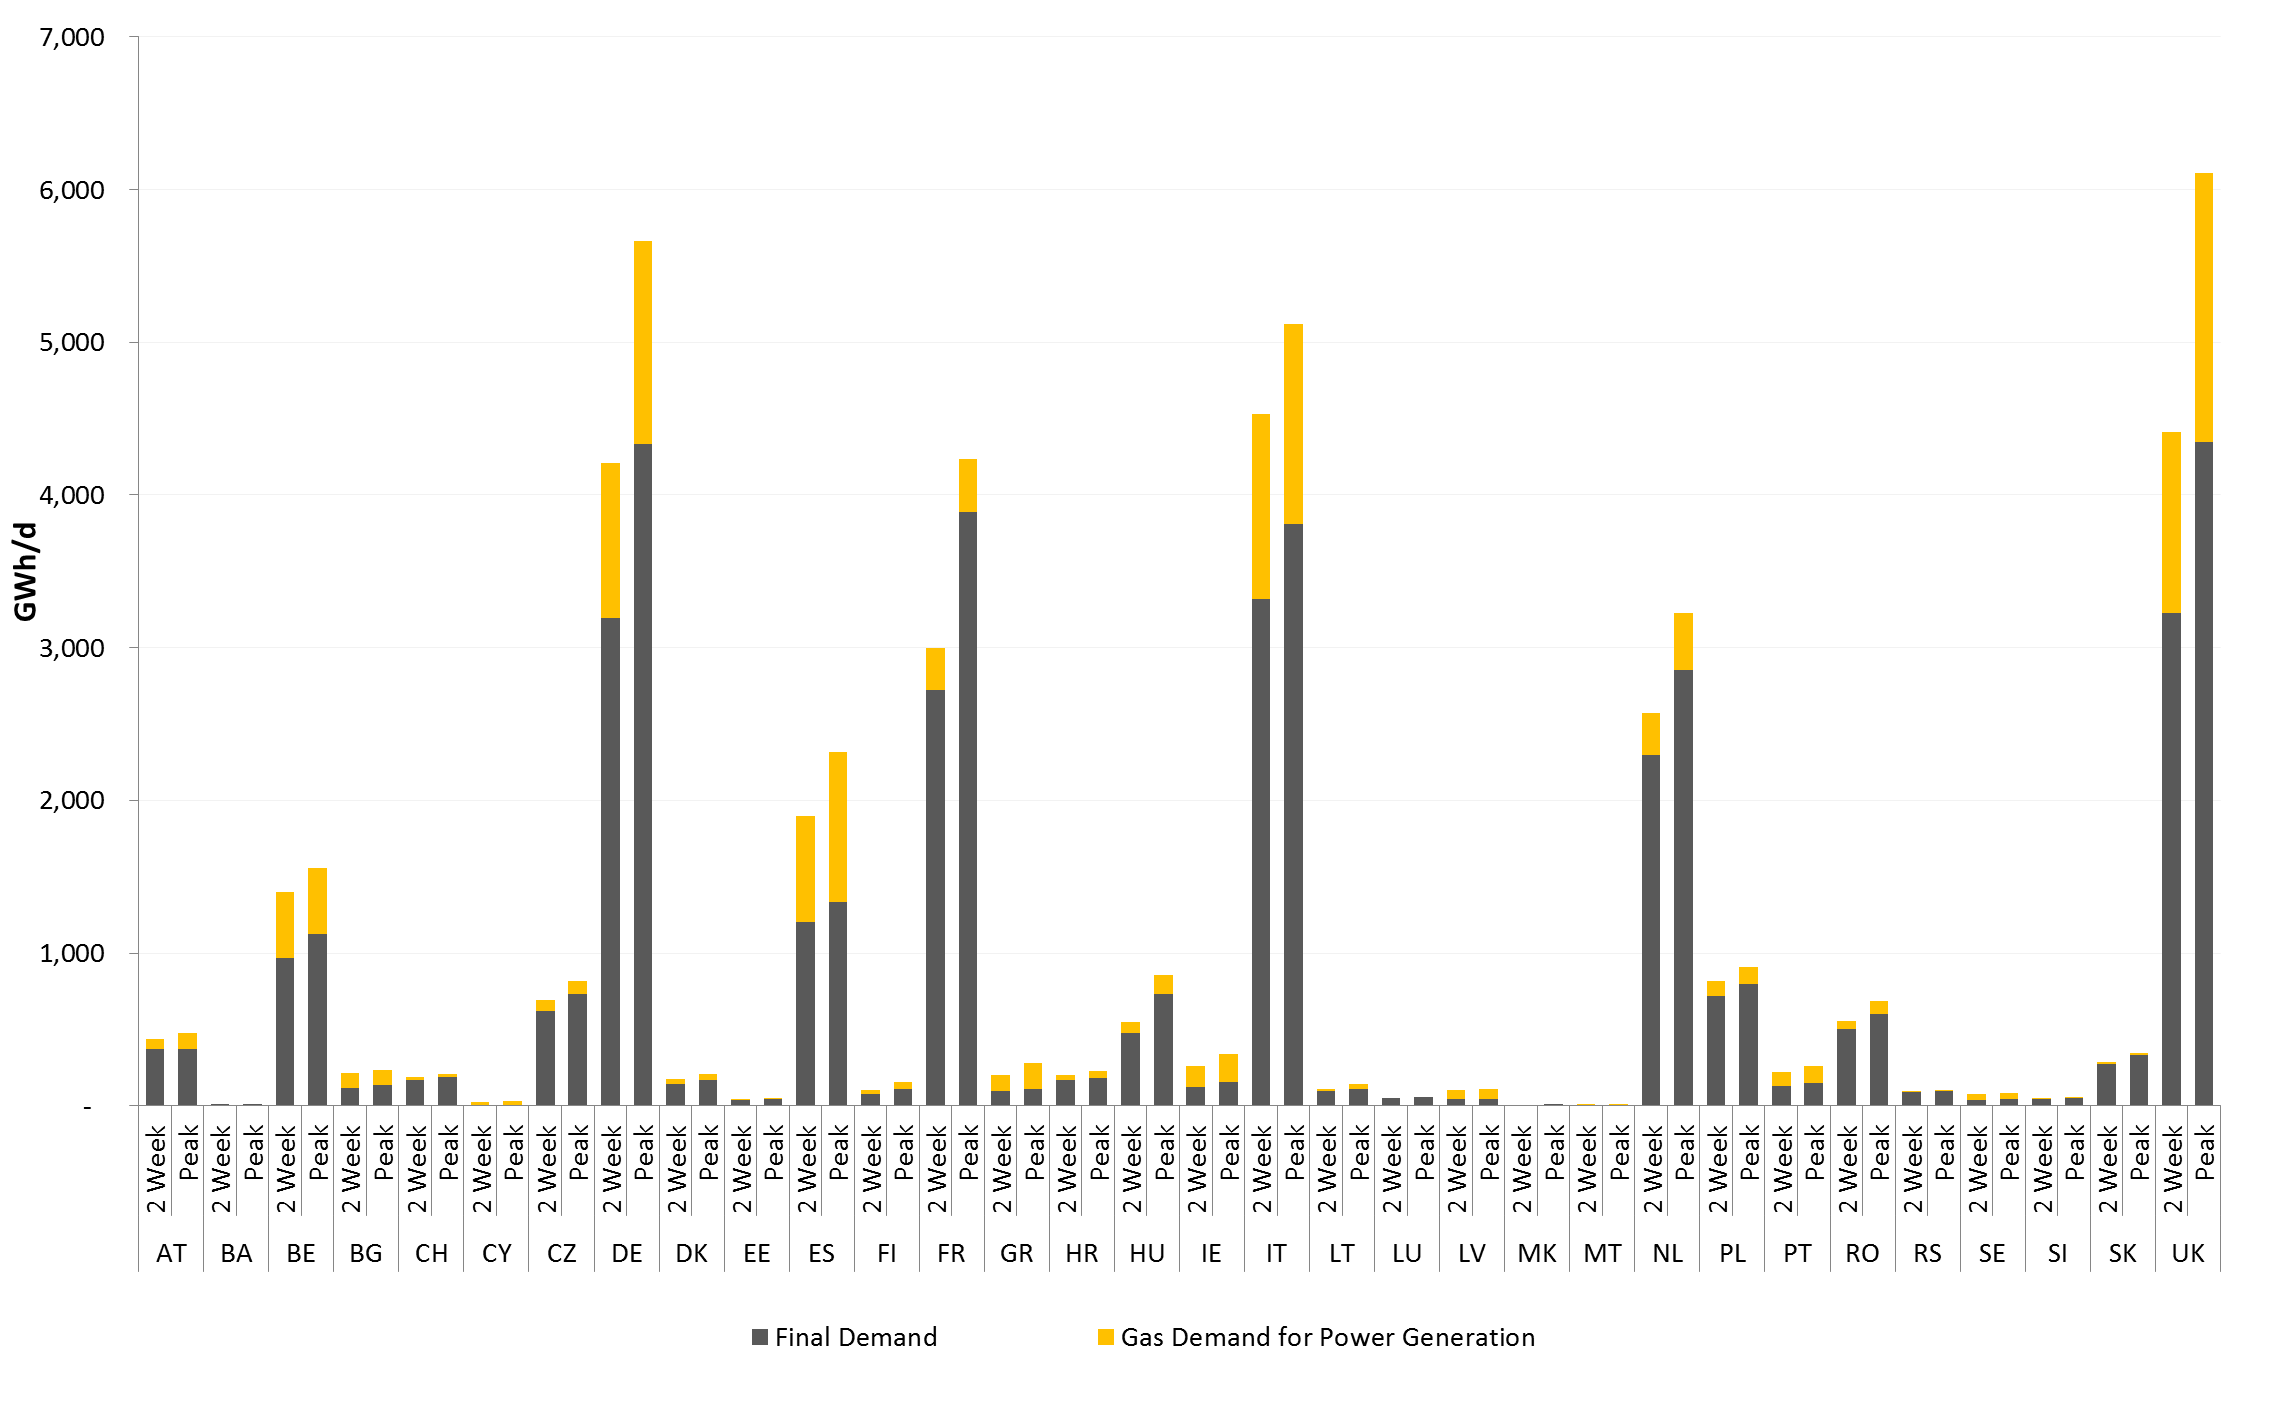
Figure 17: Gas high demand cases – 2025 Coal Before Gas
2025 – Gas Before Coal
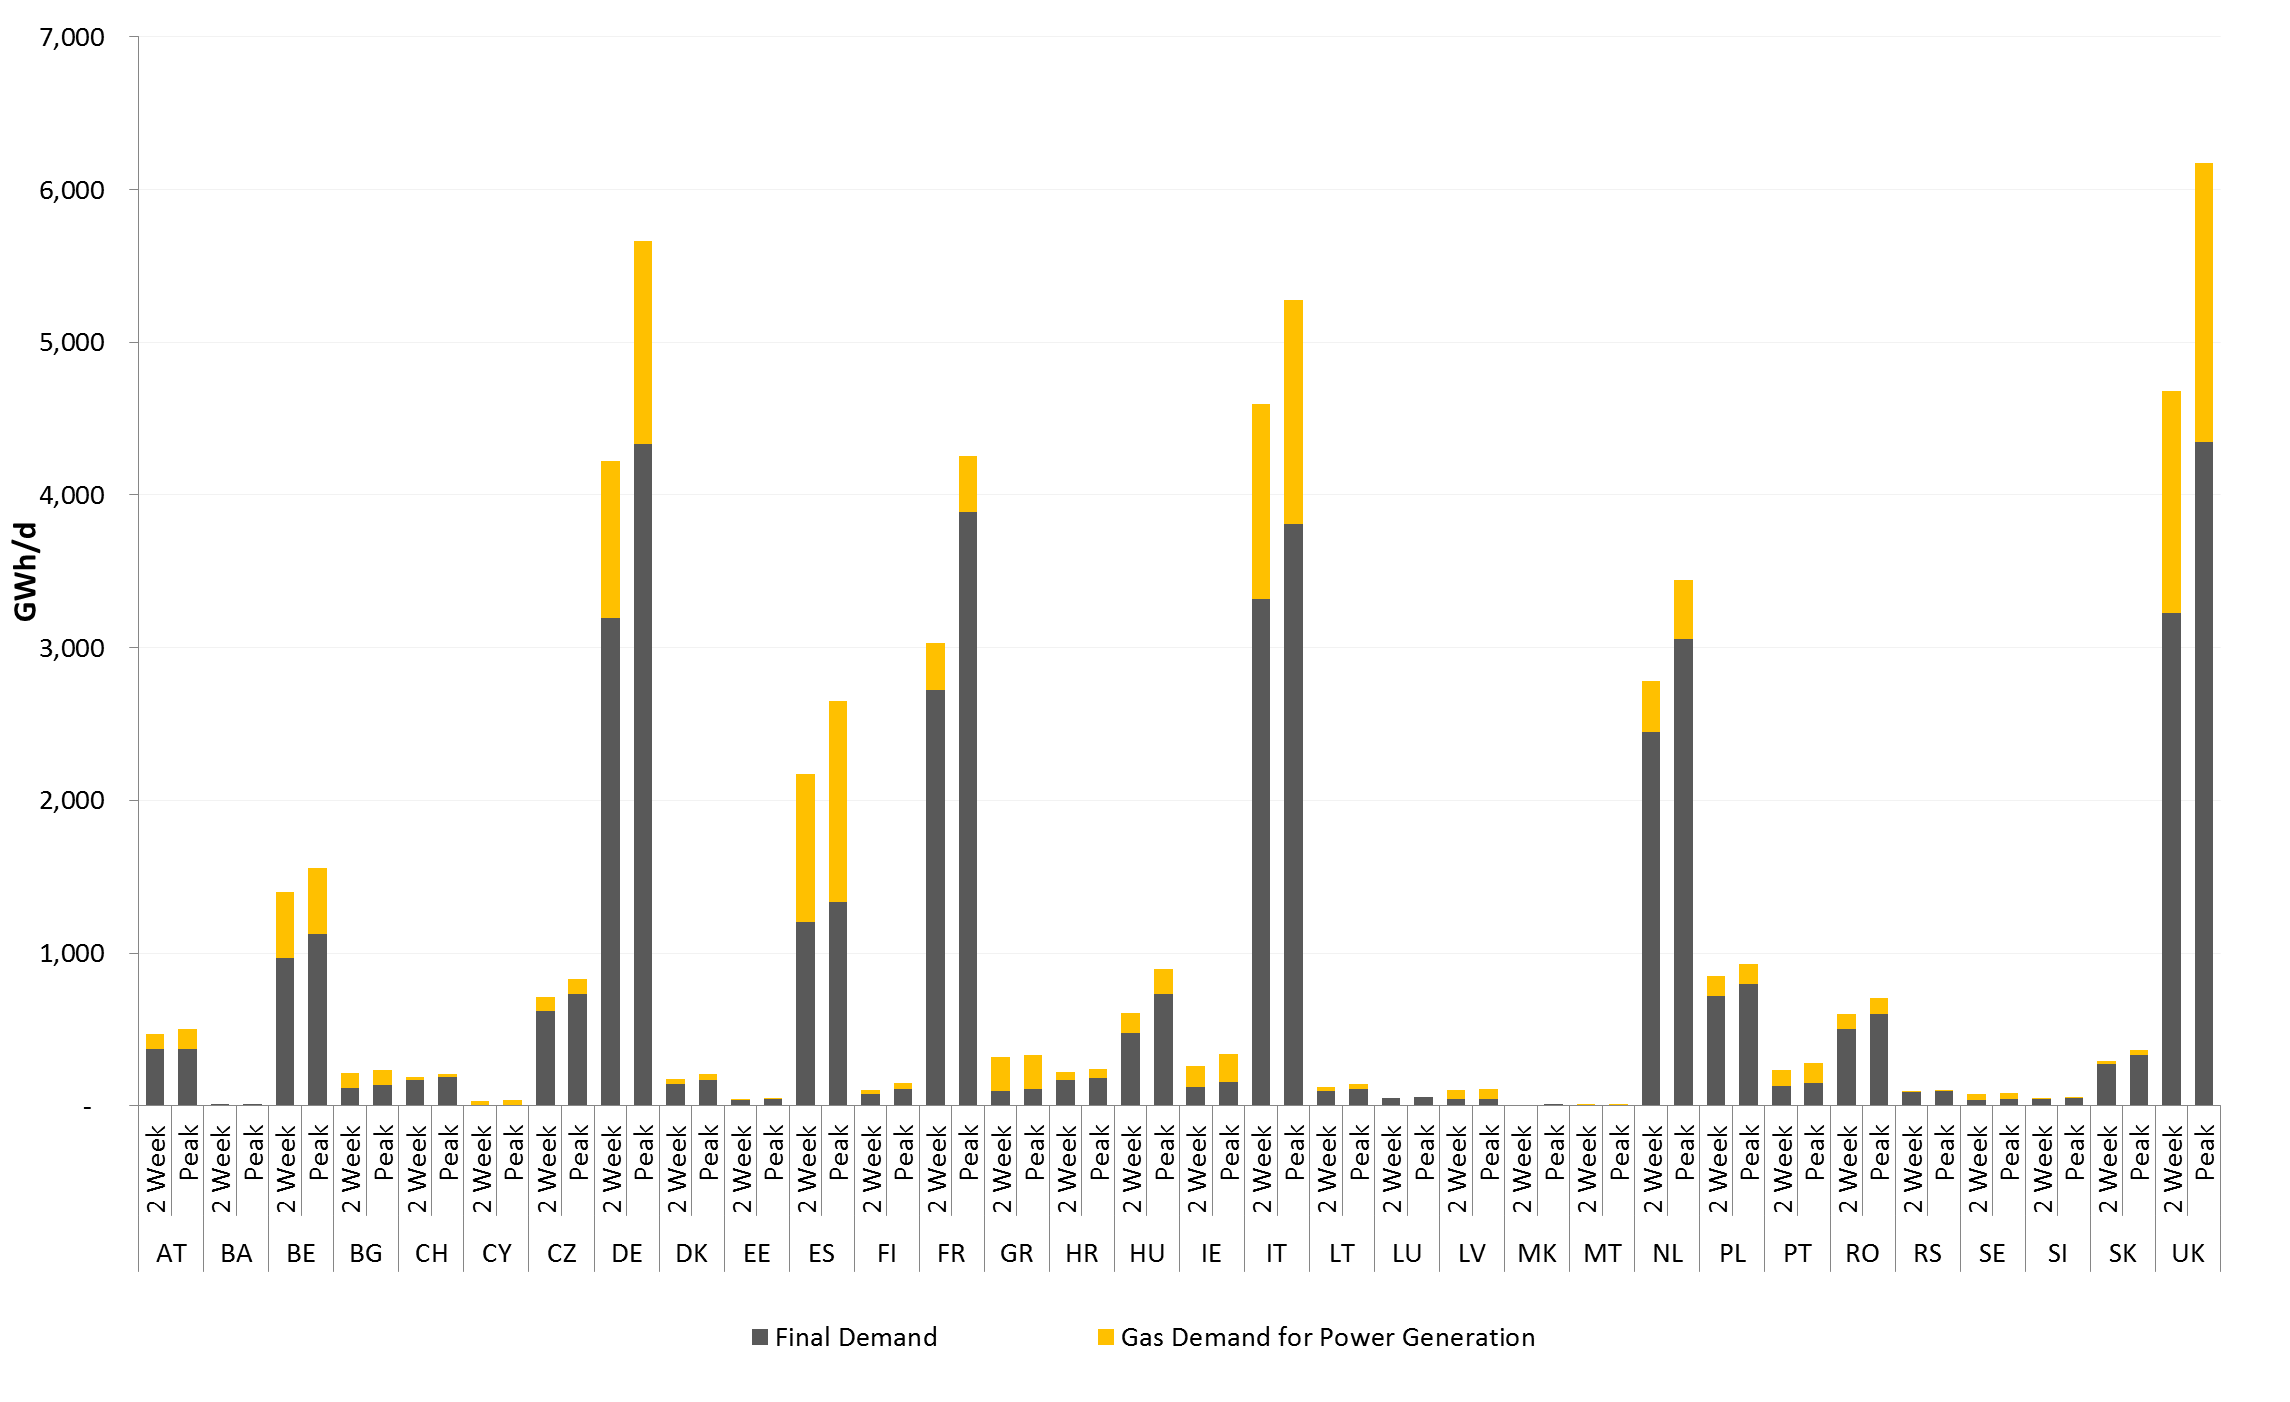
Figure 18: Gas high demand cases – 2025 Gas Before Coal
2030 – Sustainable Transition
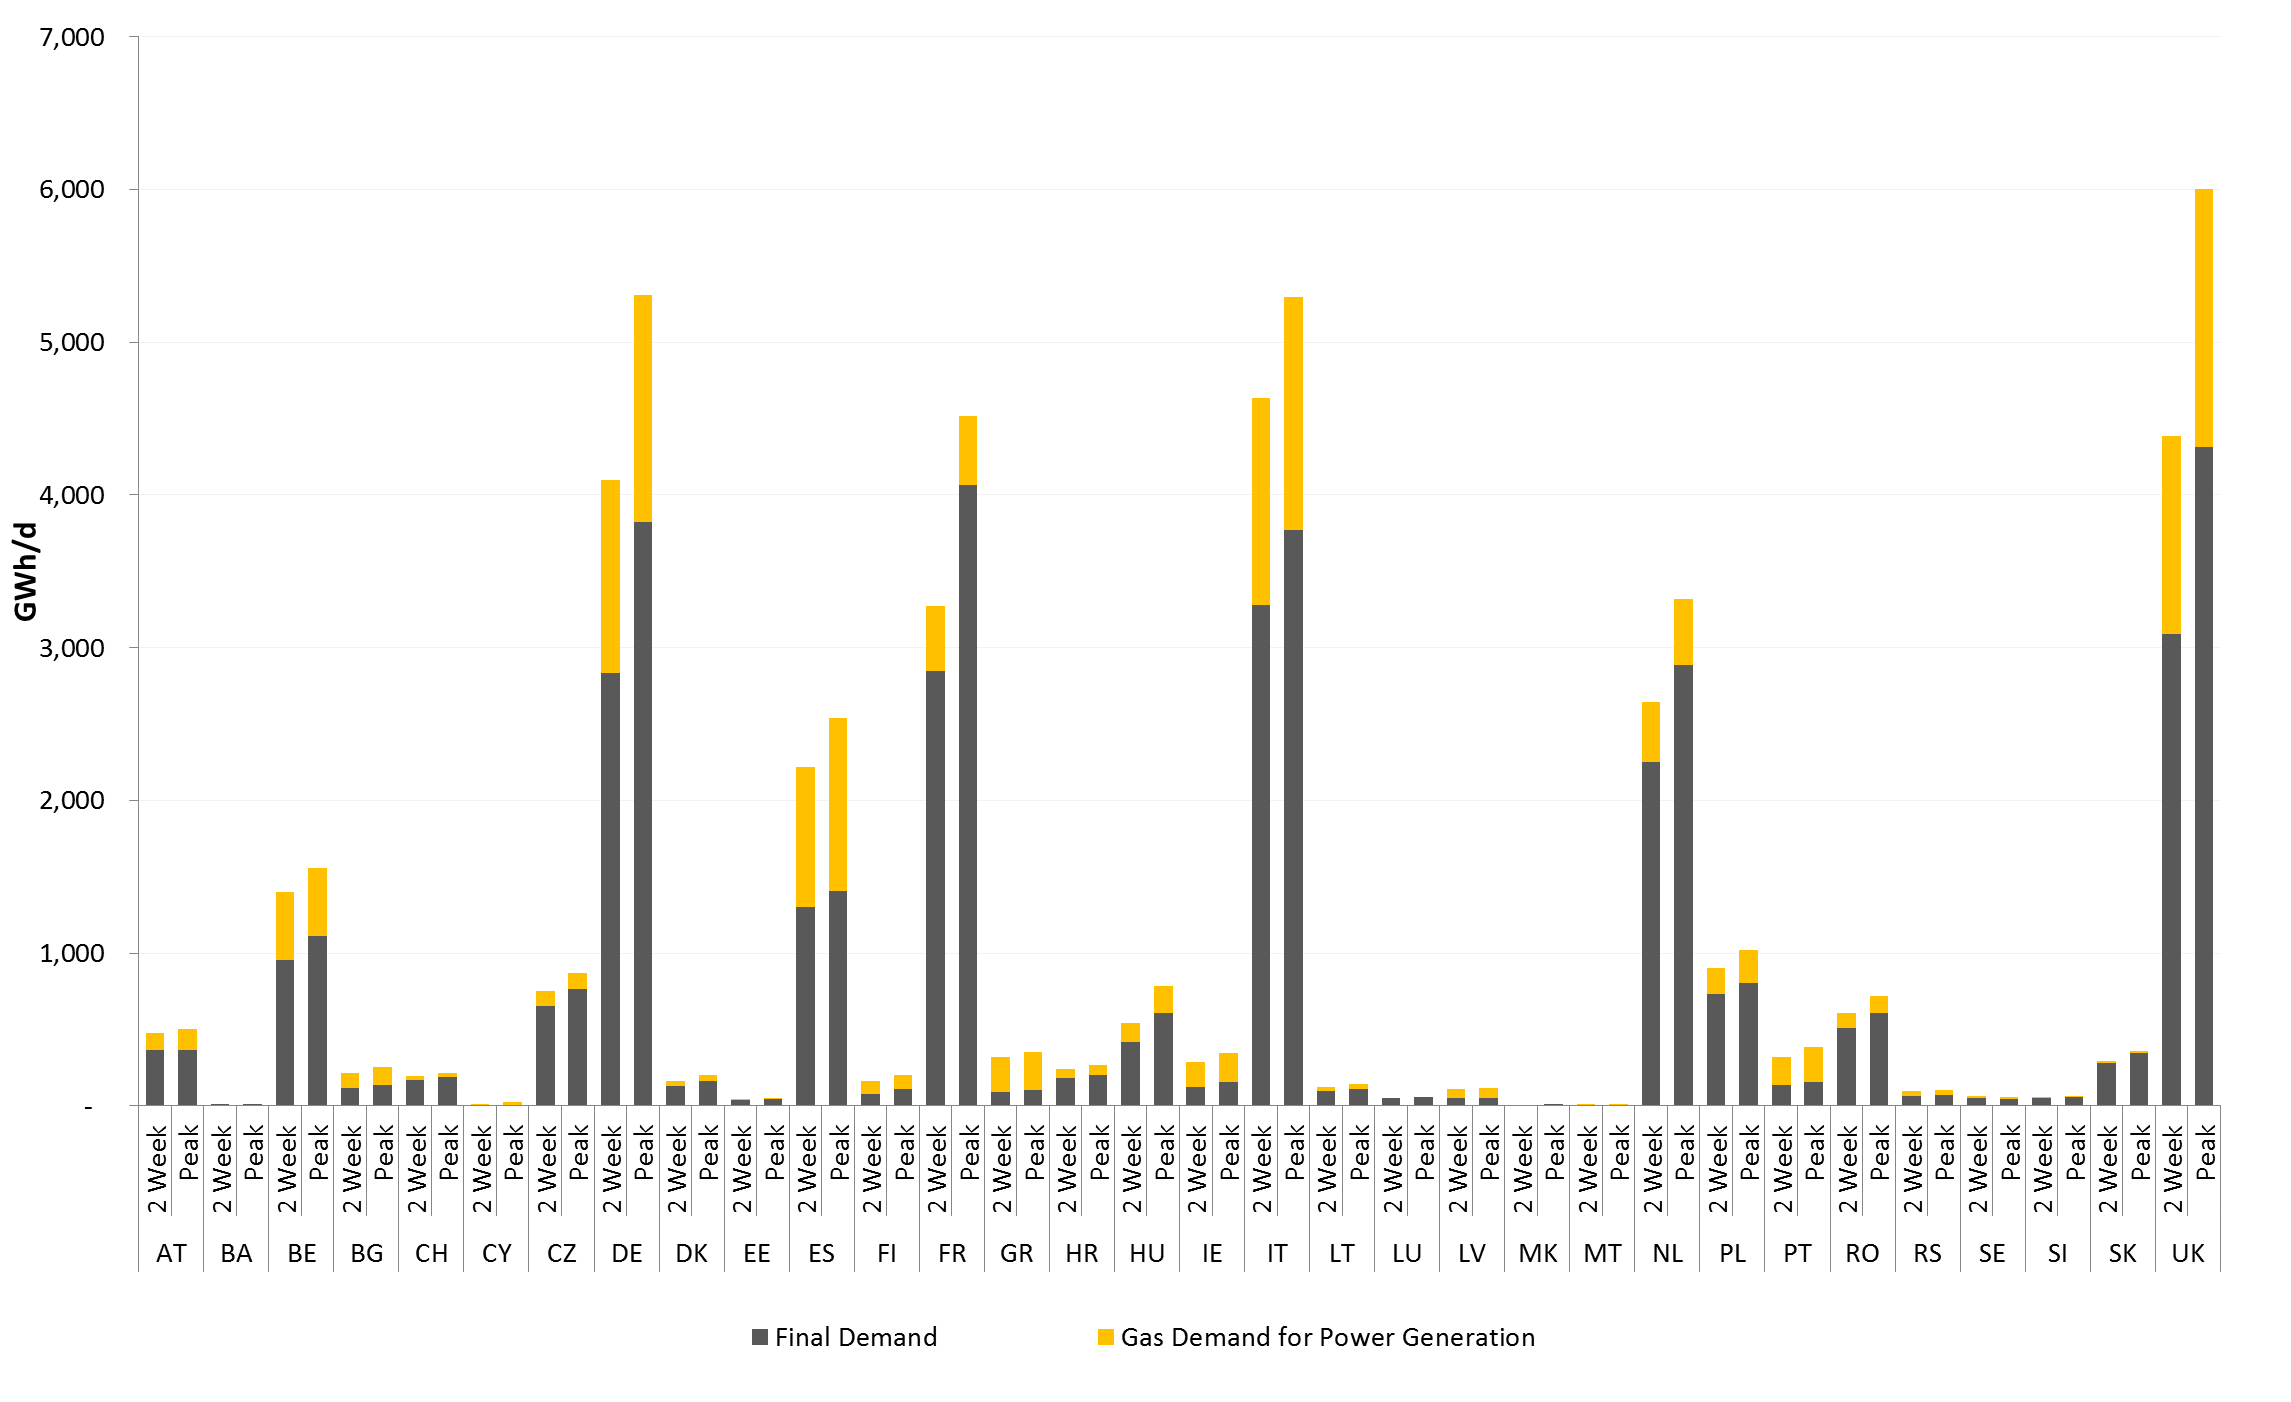
Figure 19: Gas high demand cases – 2030 Sustainable Transition
2030 – Distributed Generation
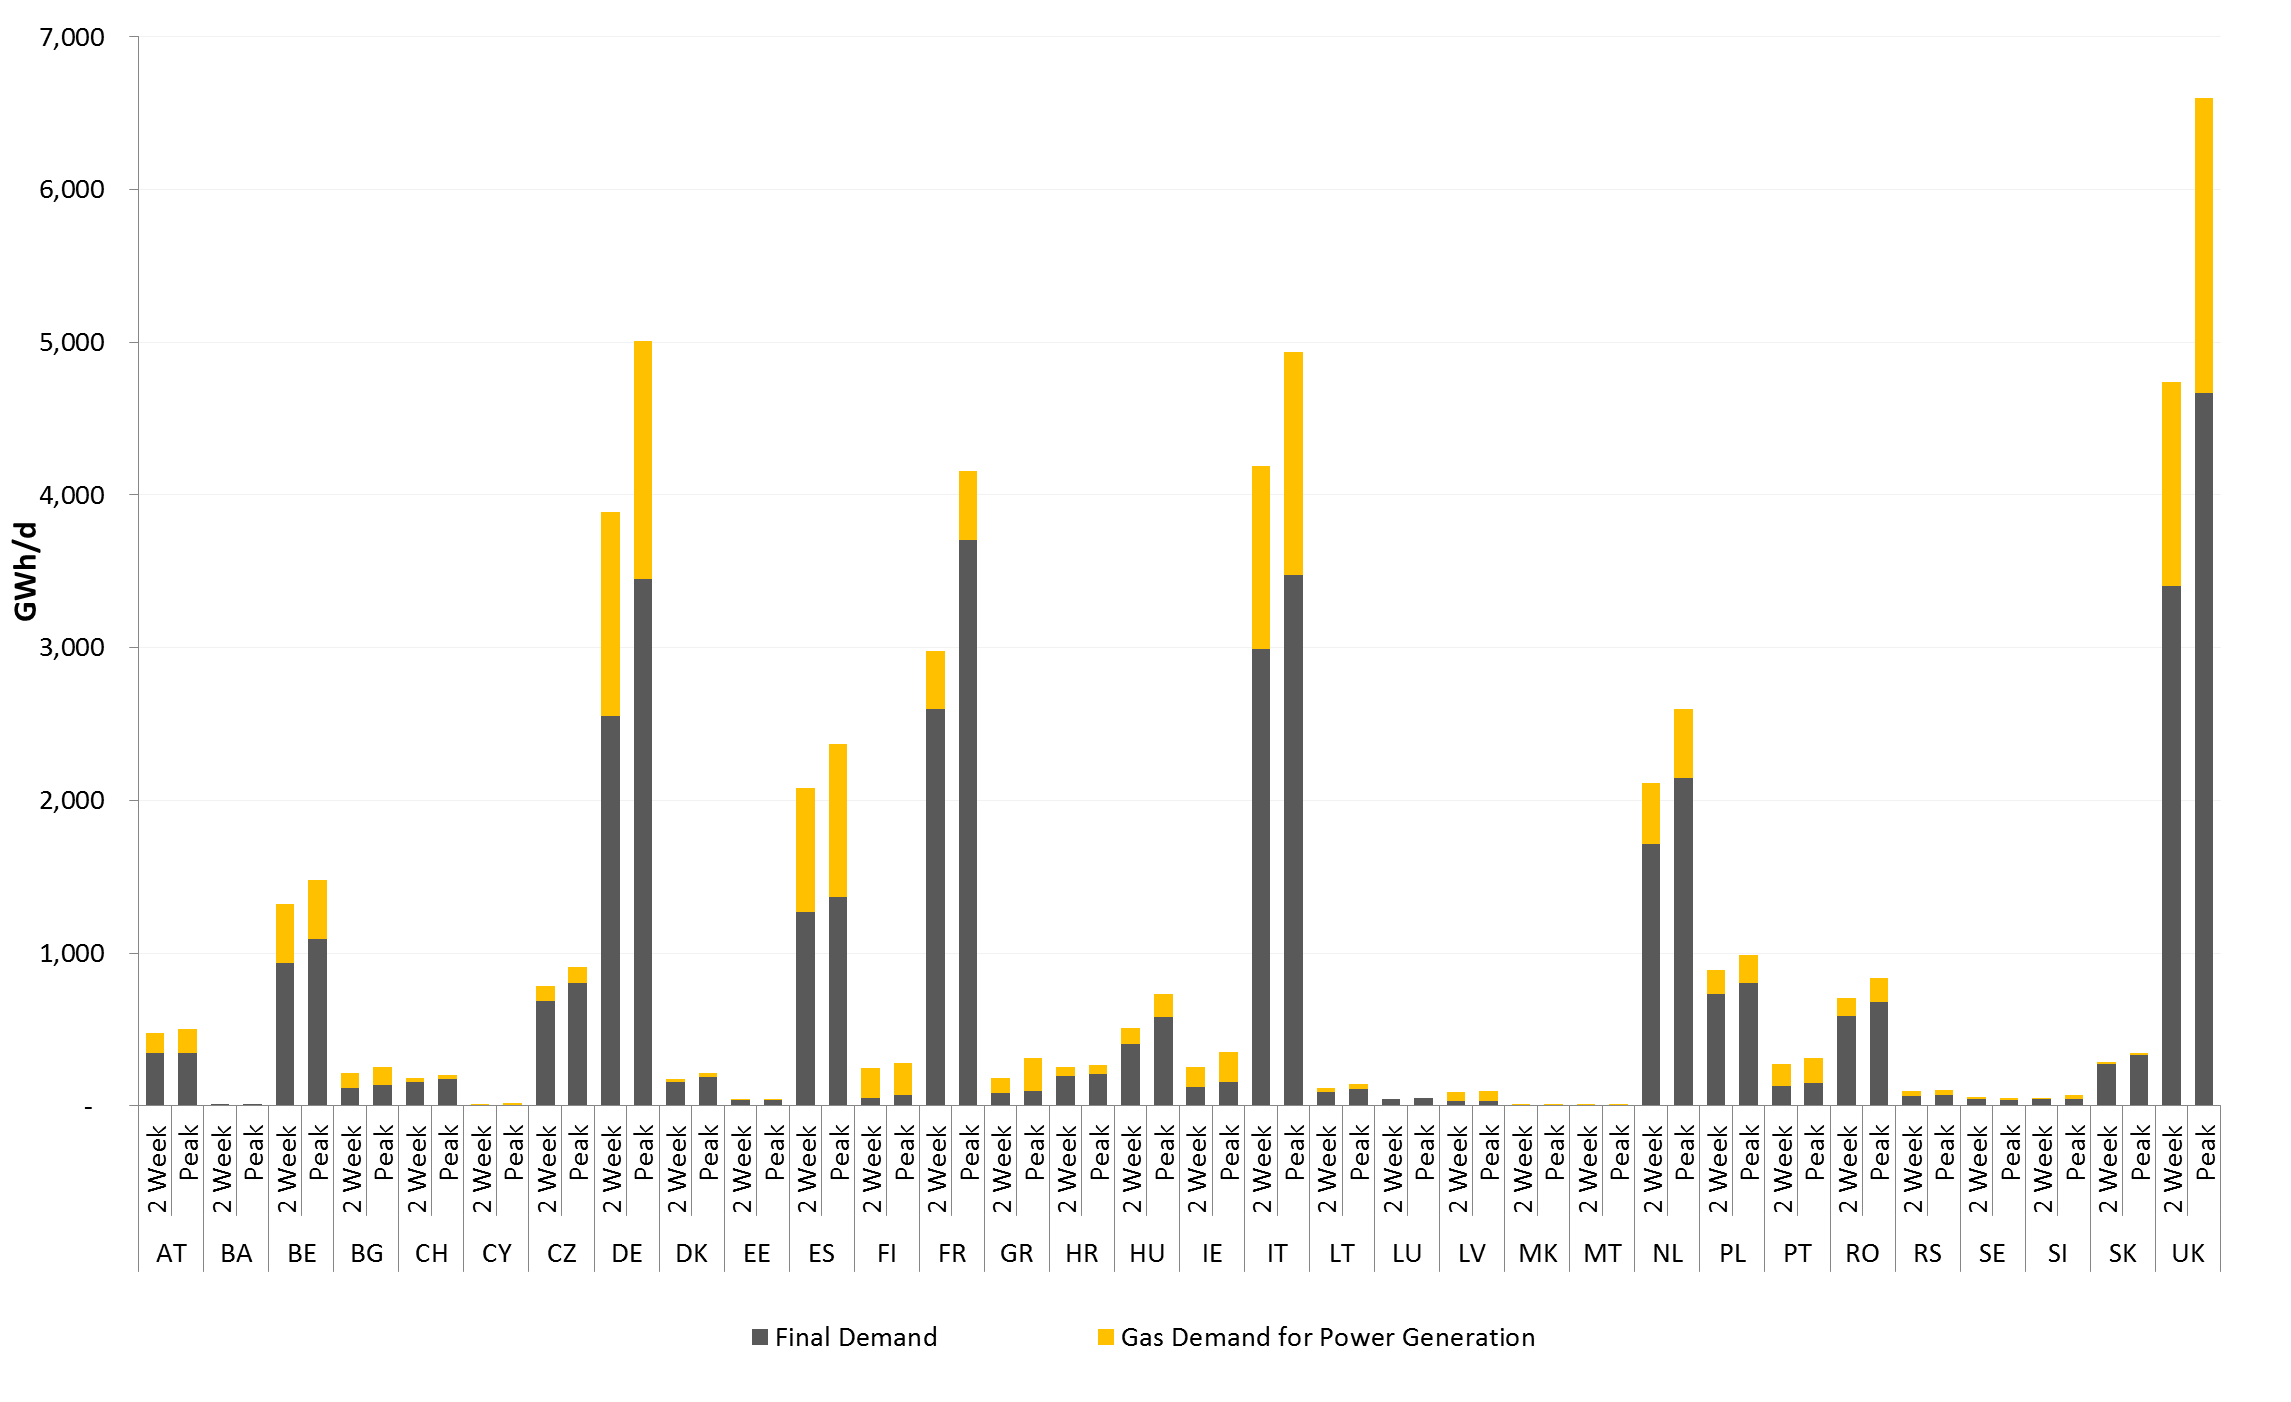
Figure 20: Gas high demand cases – 2030 Distributed Generation
2030 – External scenario based on EUCO30
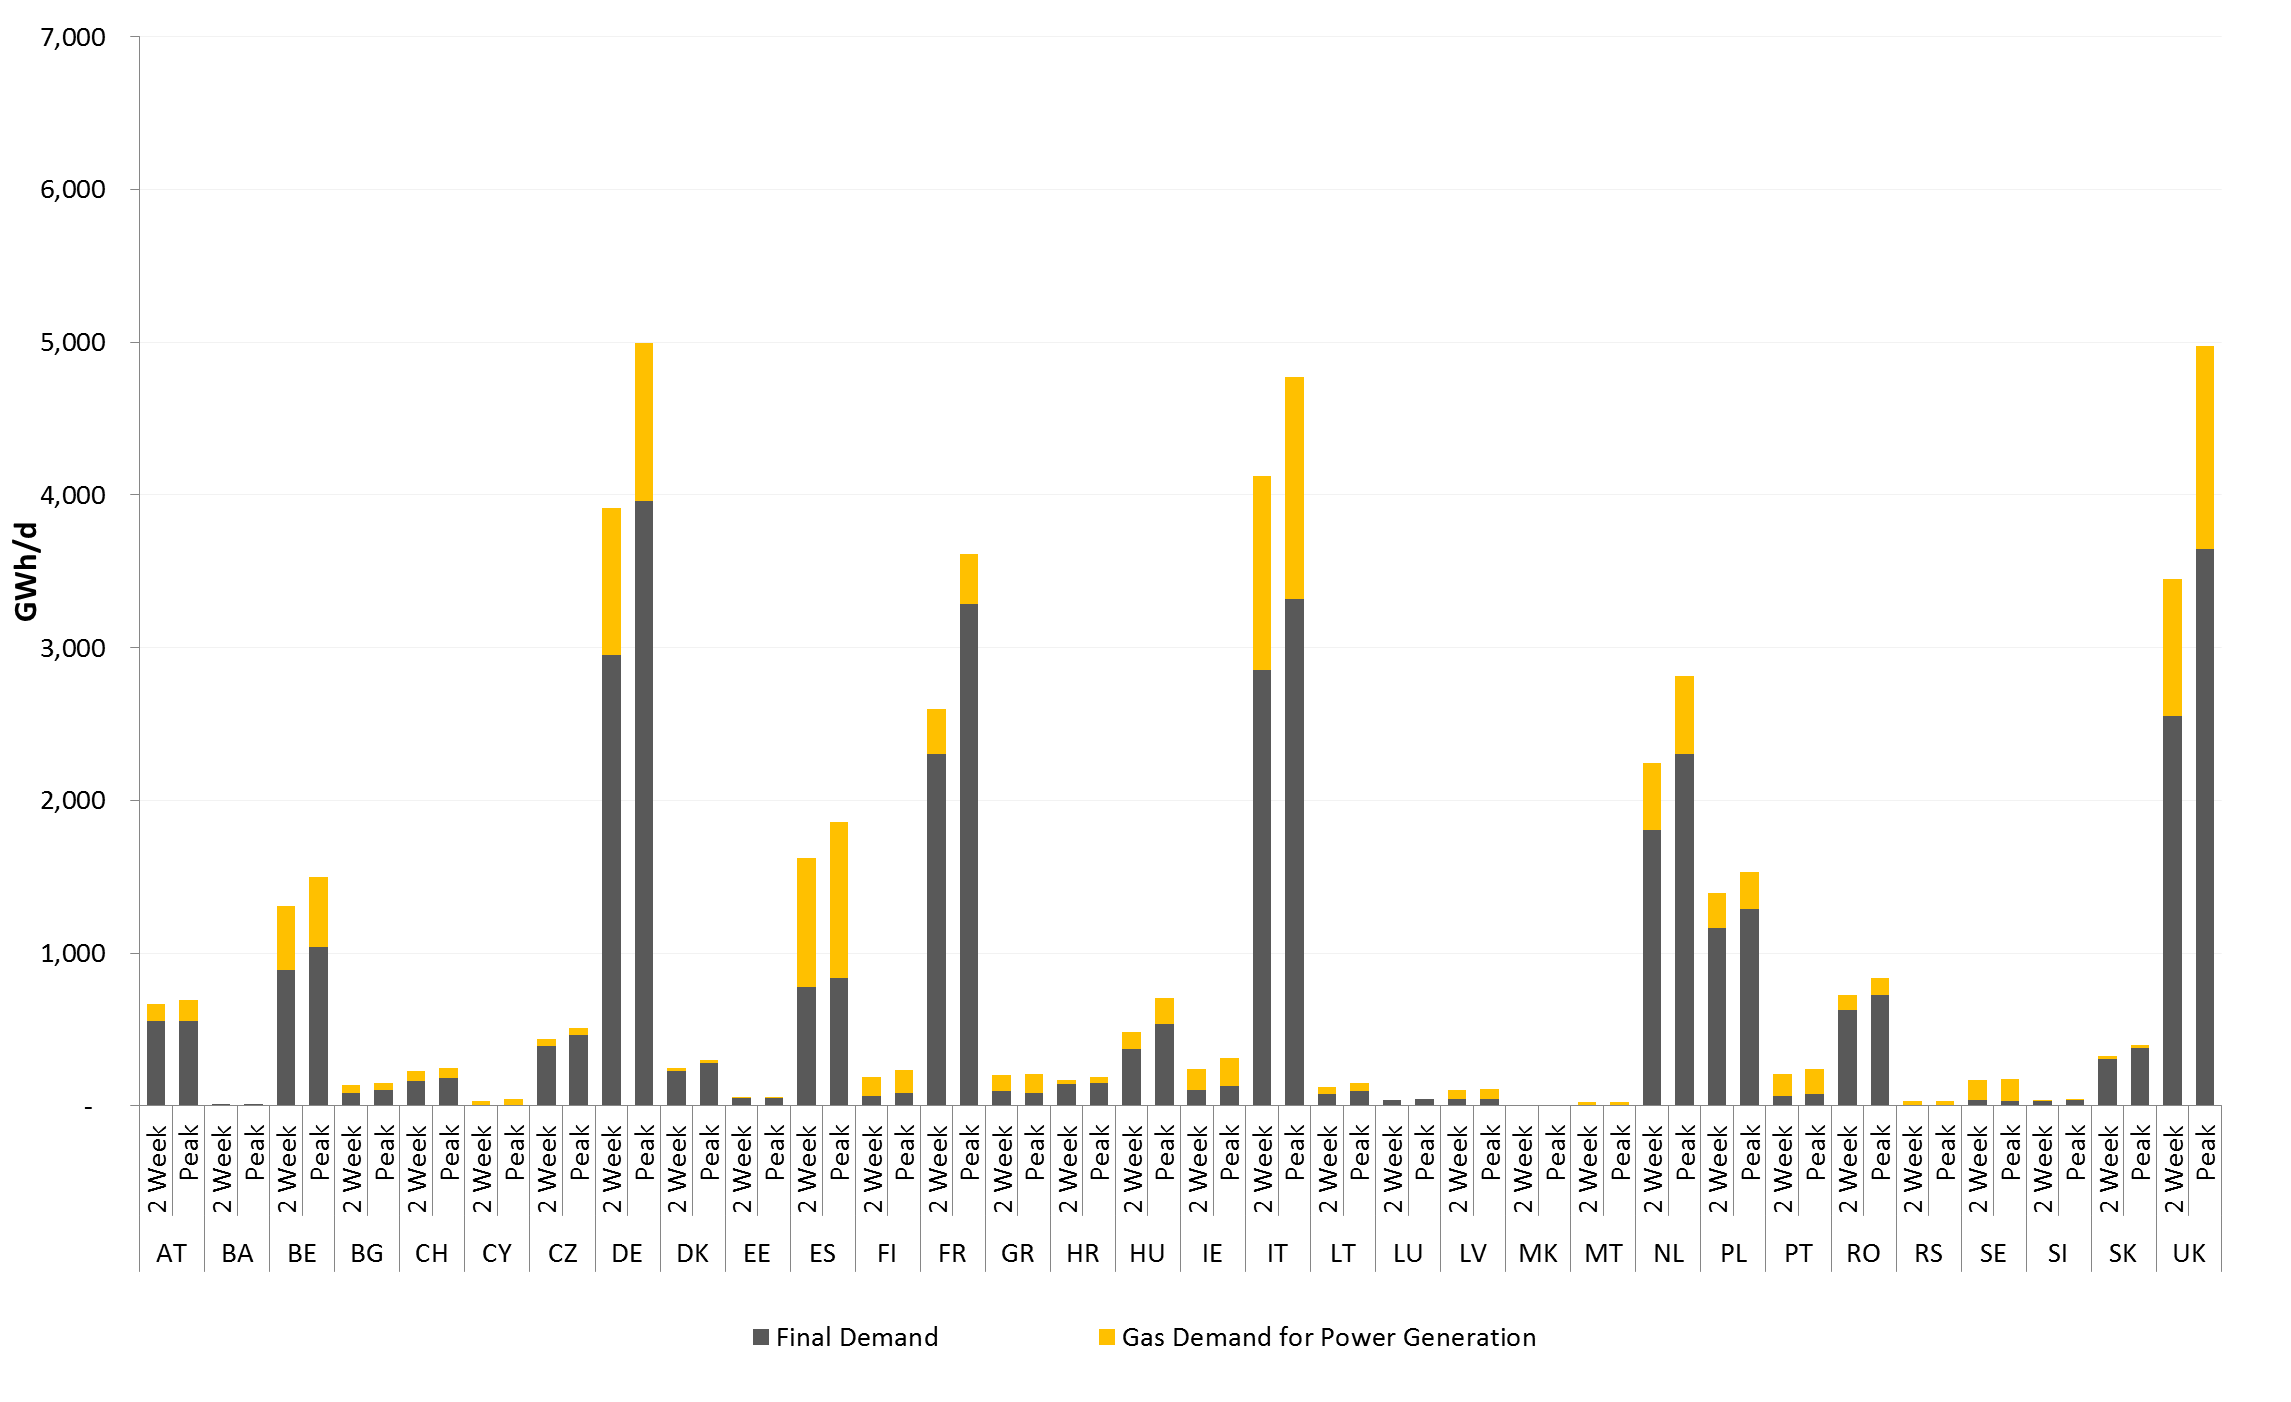
Figure 21: Gas high demand cases – 2030 External Scenario based on EUCO30
2040 – Sustainable Transition
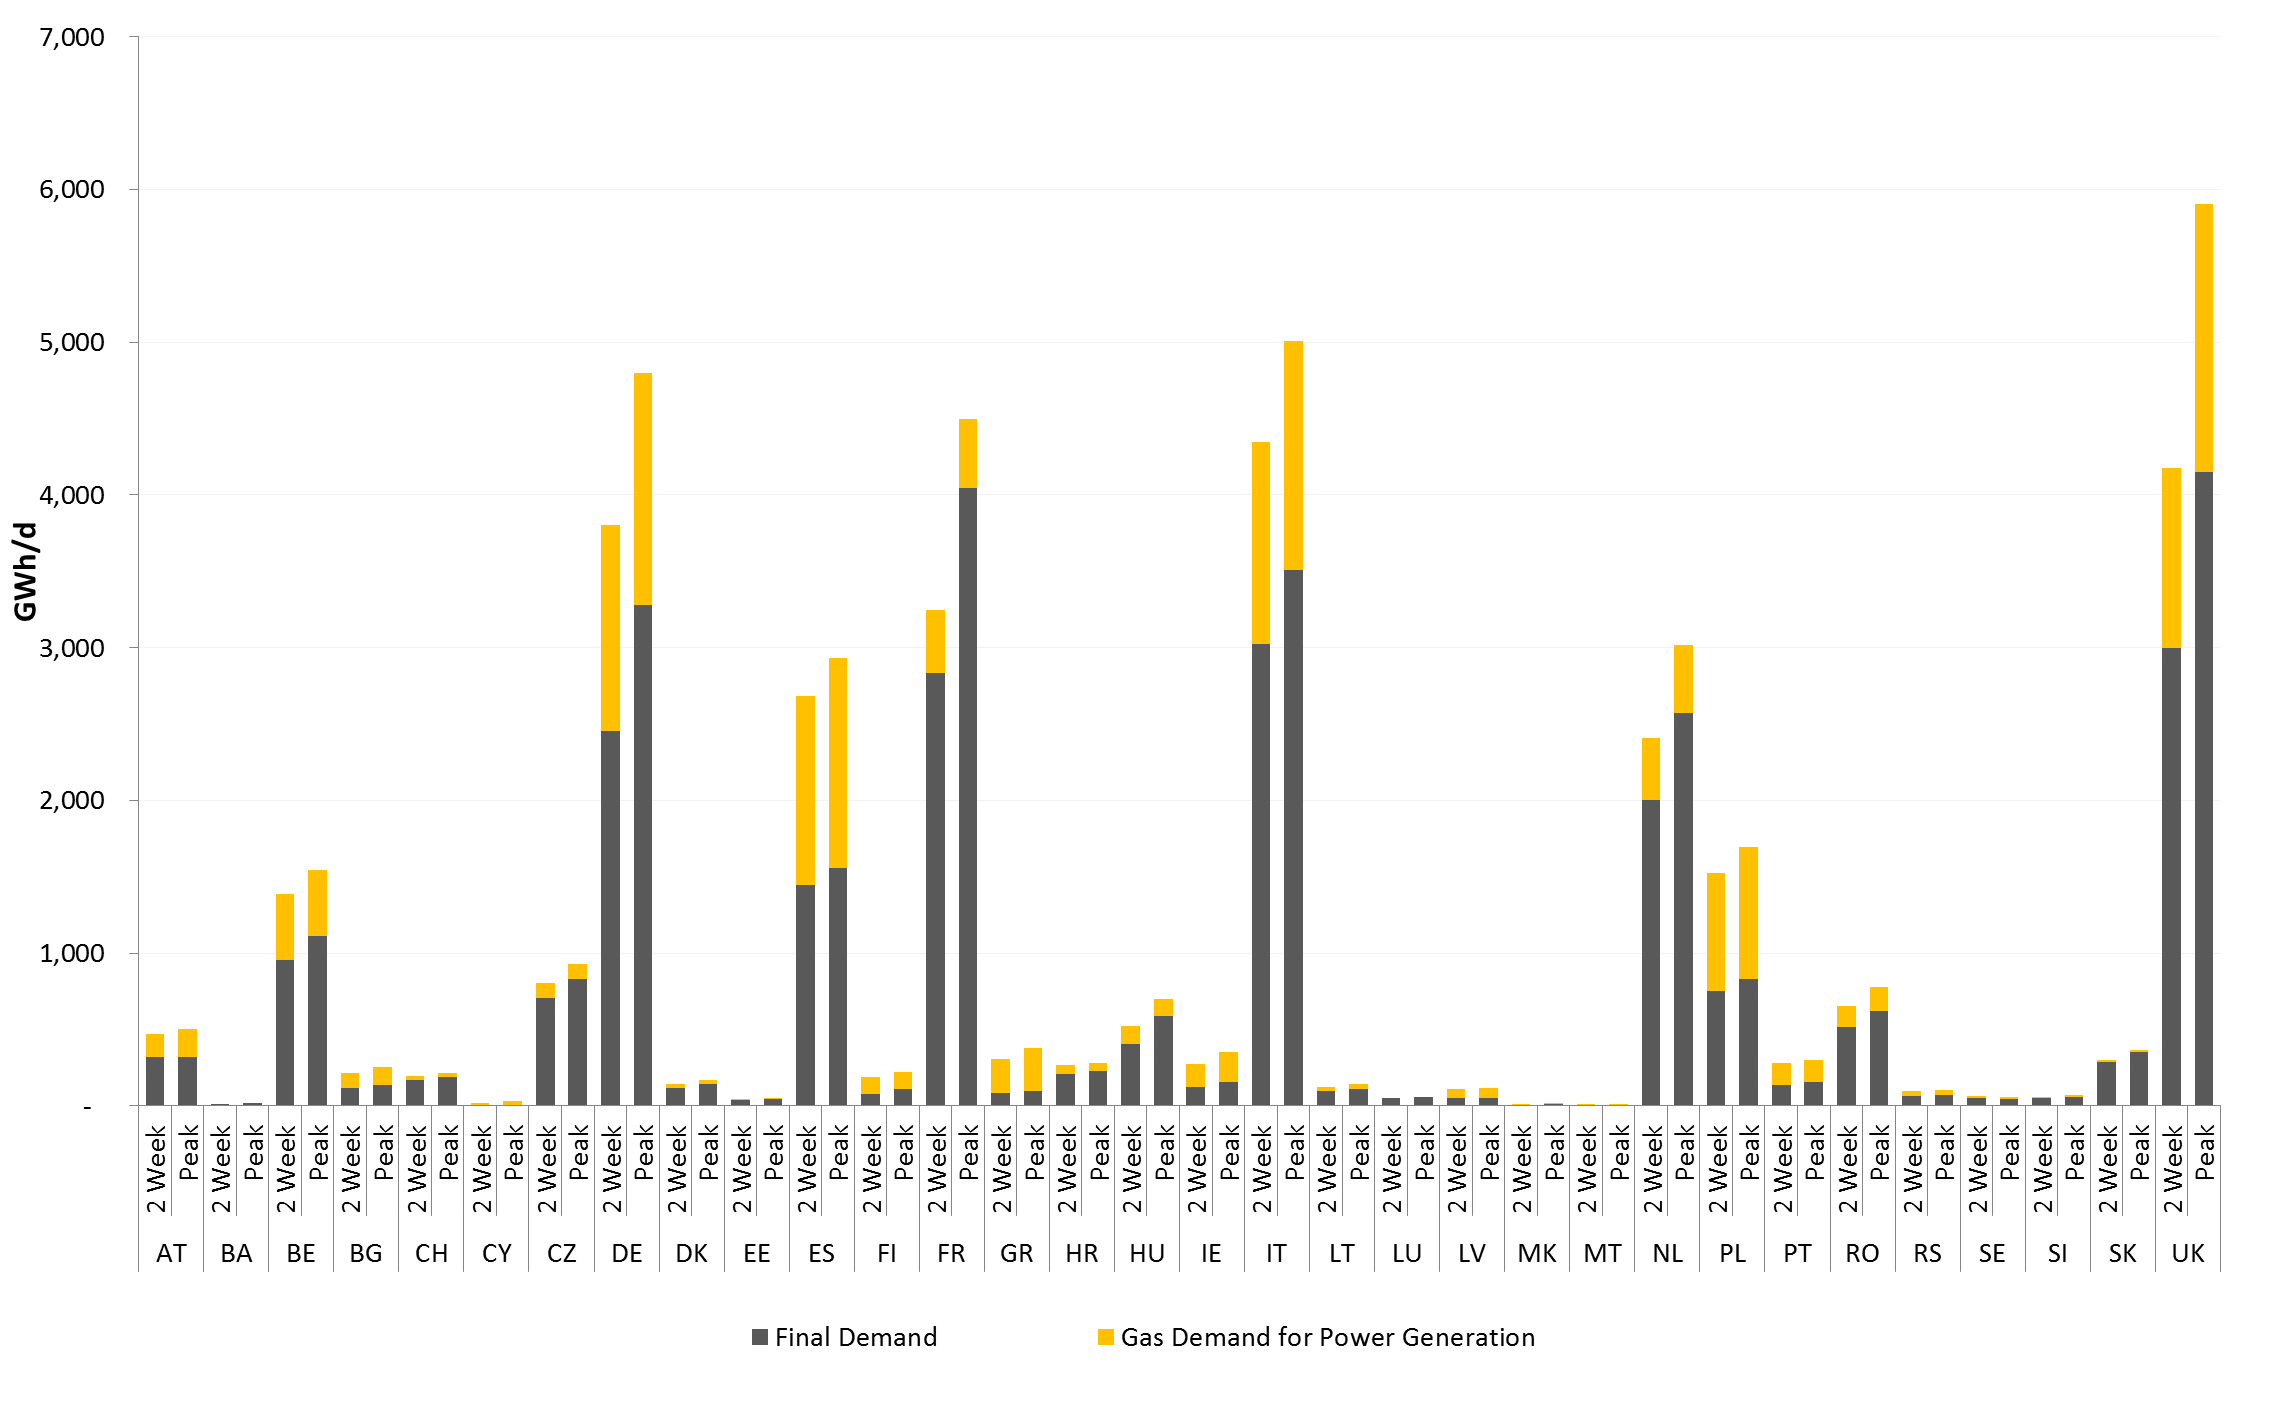
Figure 22: Gas high demand cases - 2040 Sustainable Transition
2040 – Distributed Generation
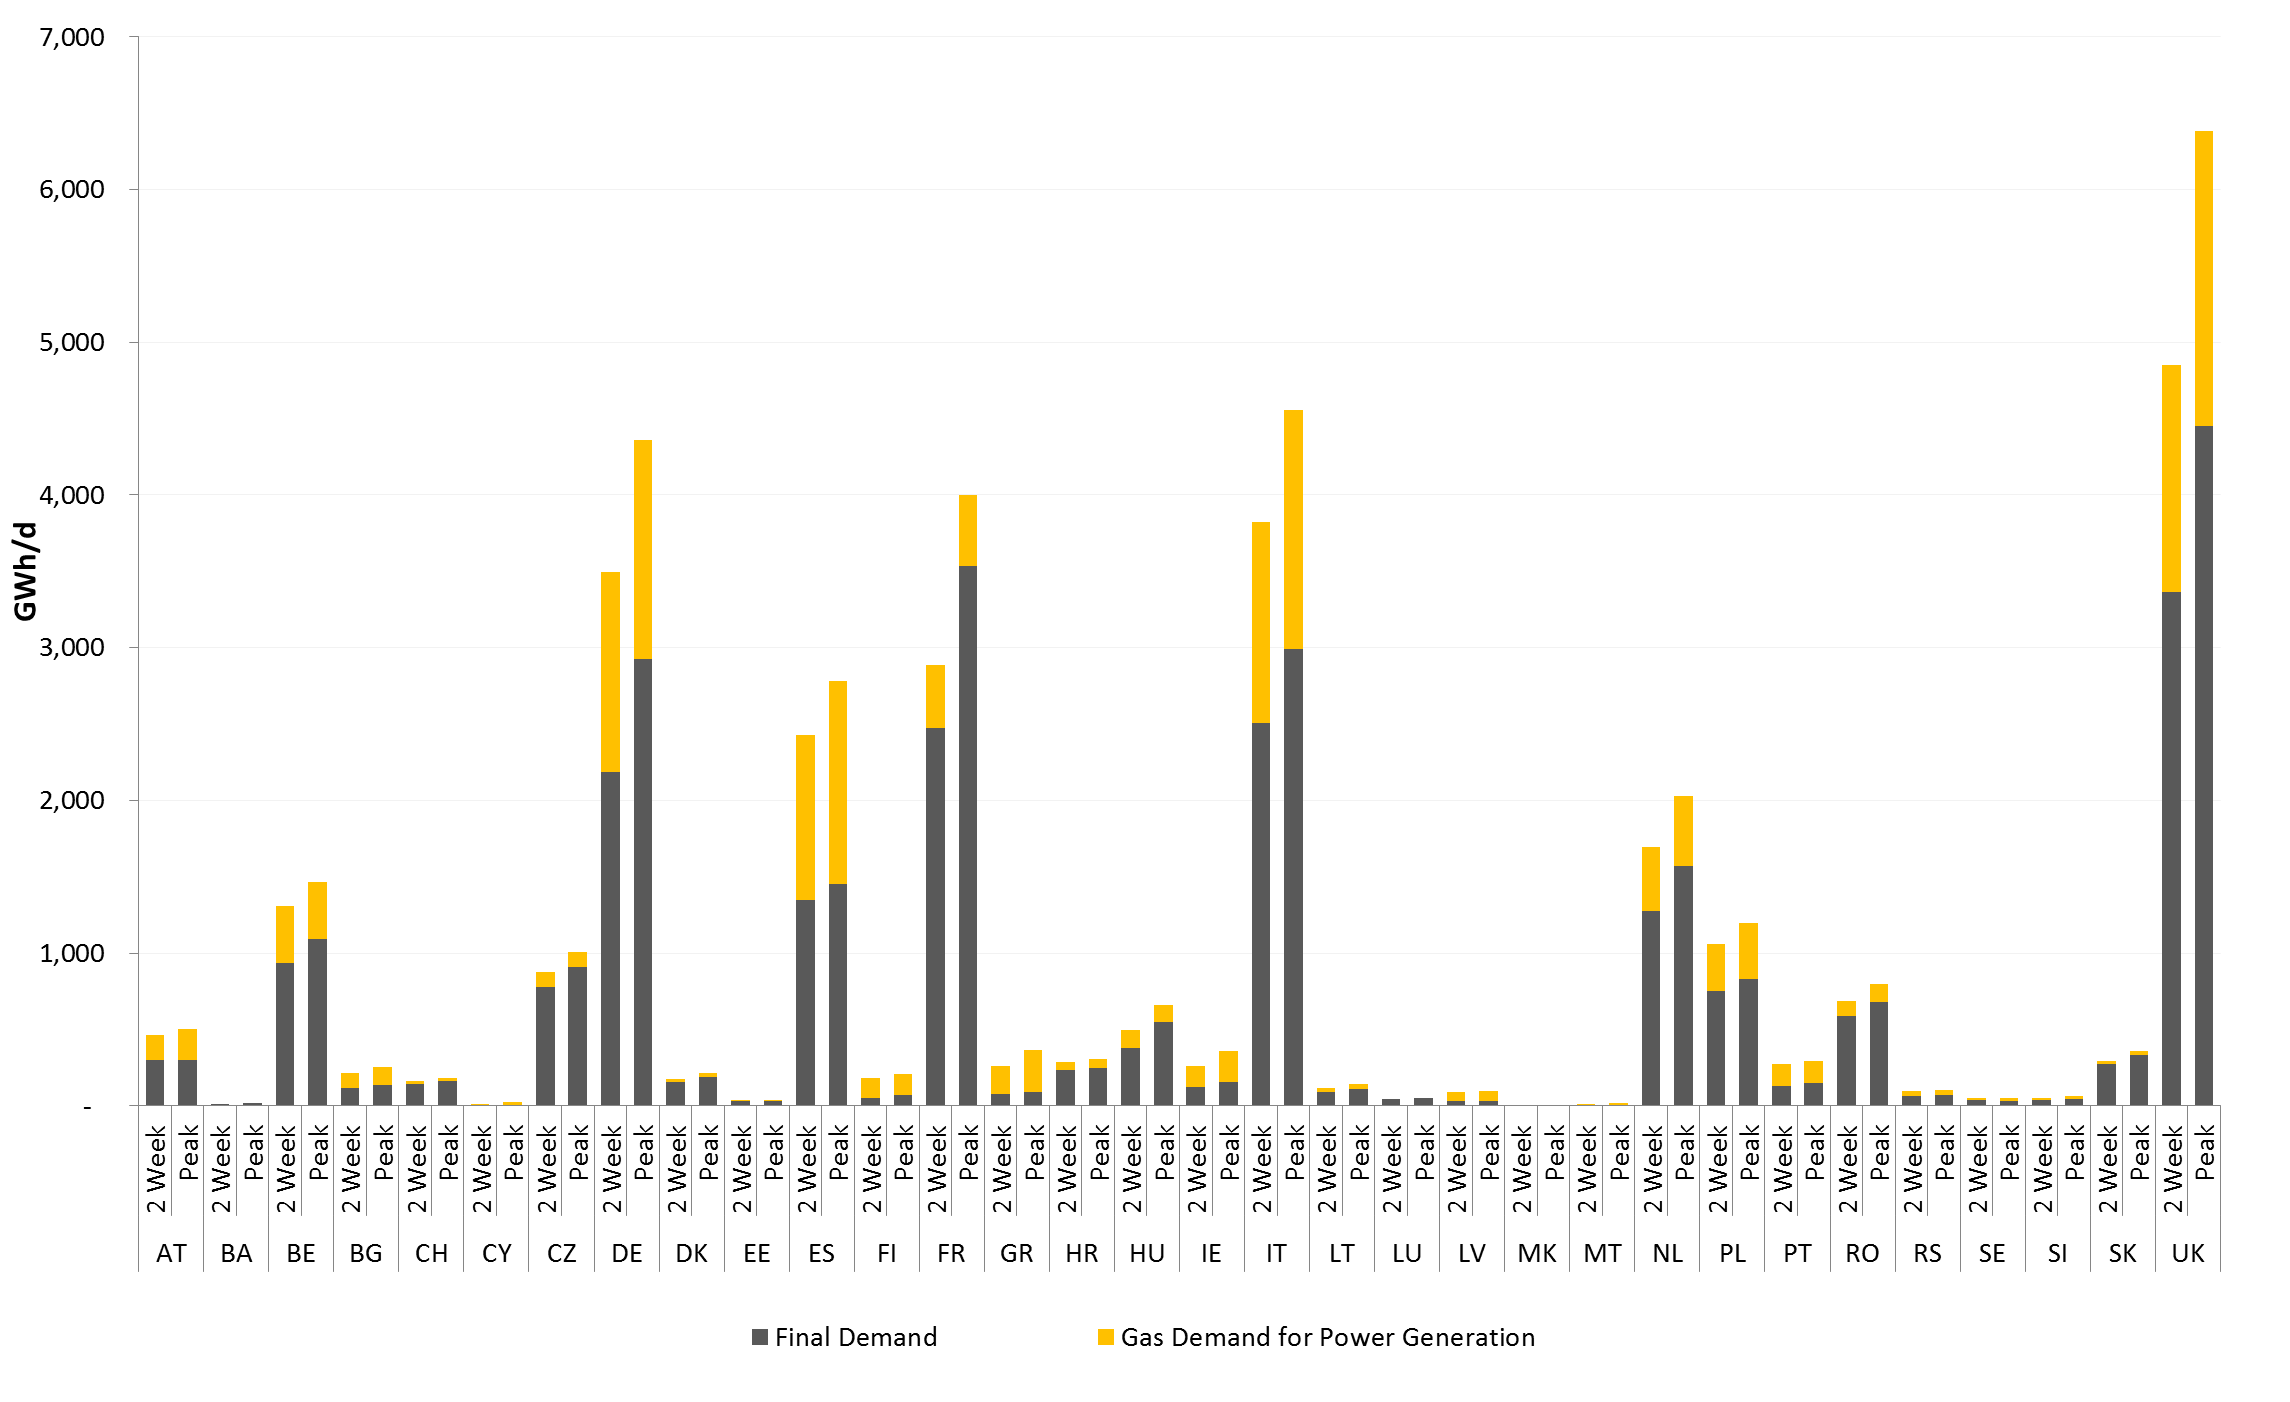
Figure 23: Gas high demand cases – 2040 Distributed Generation
2040 – Global Climate Action
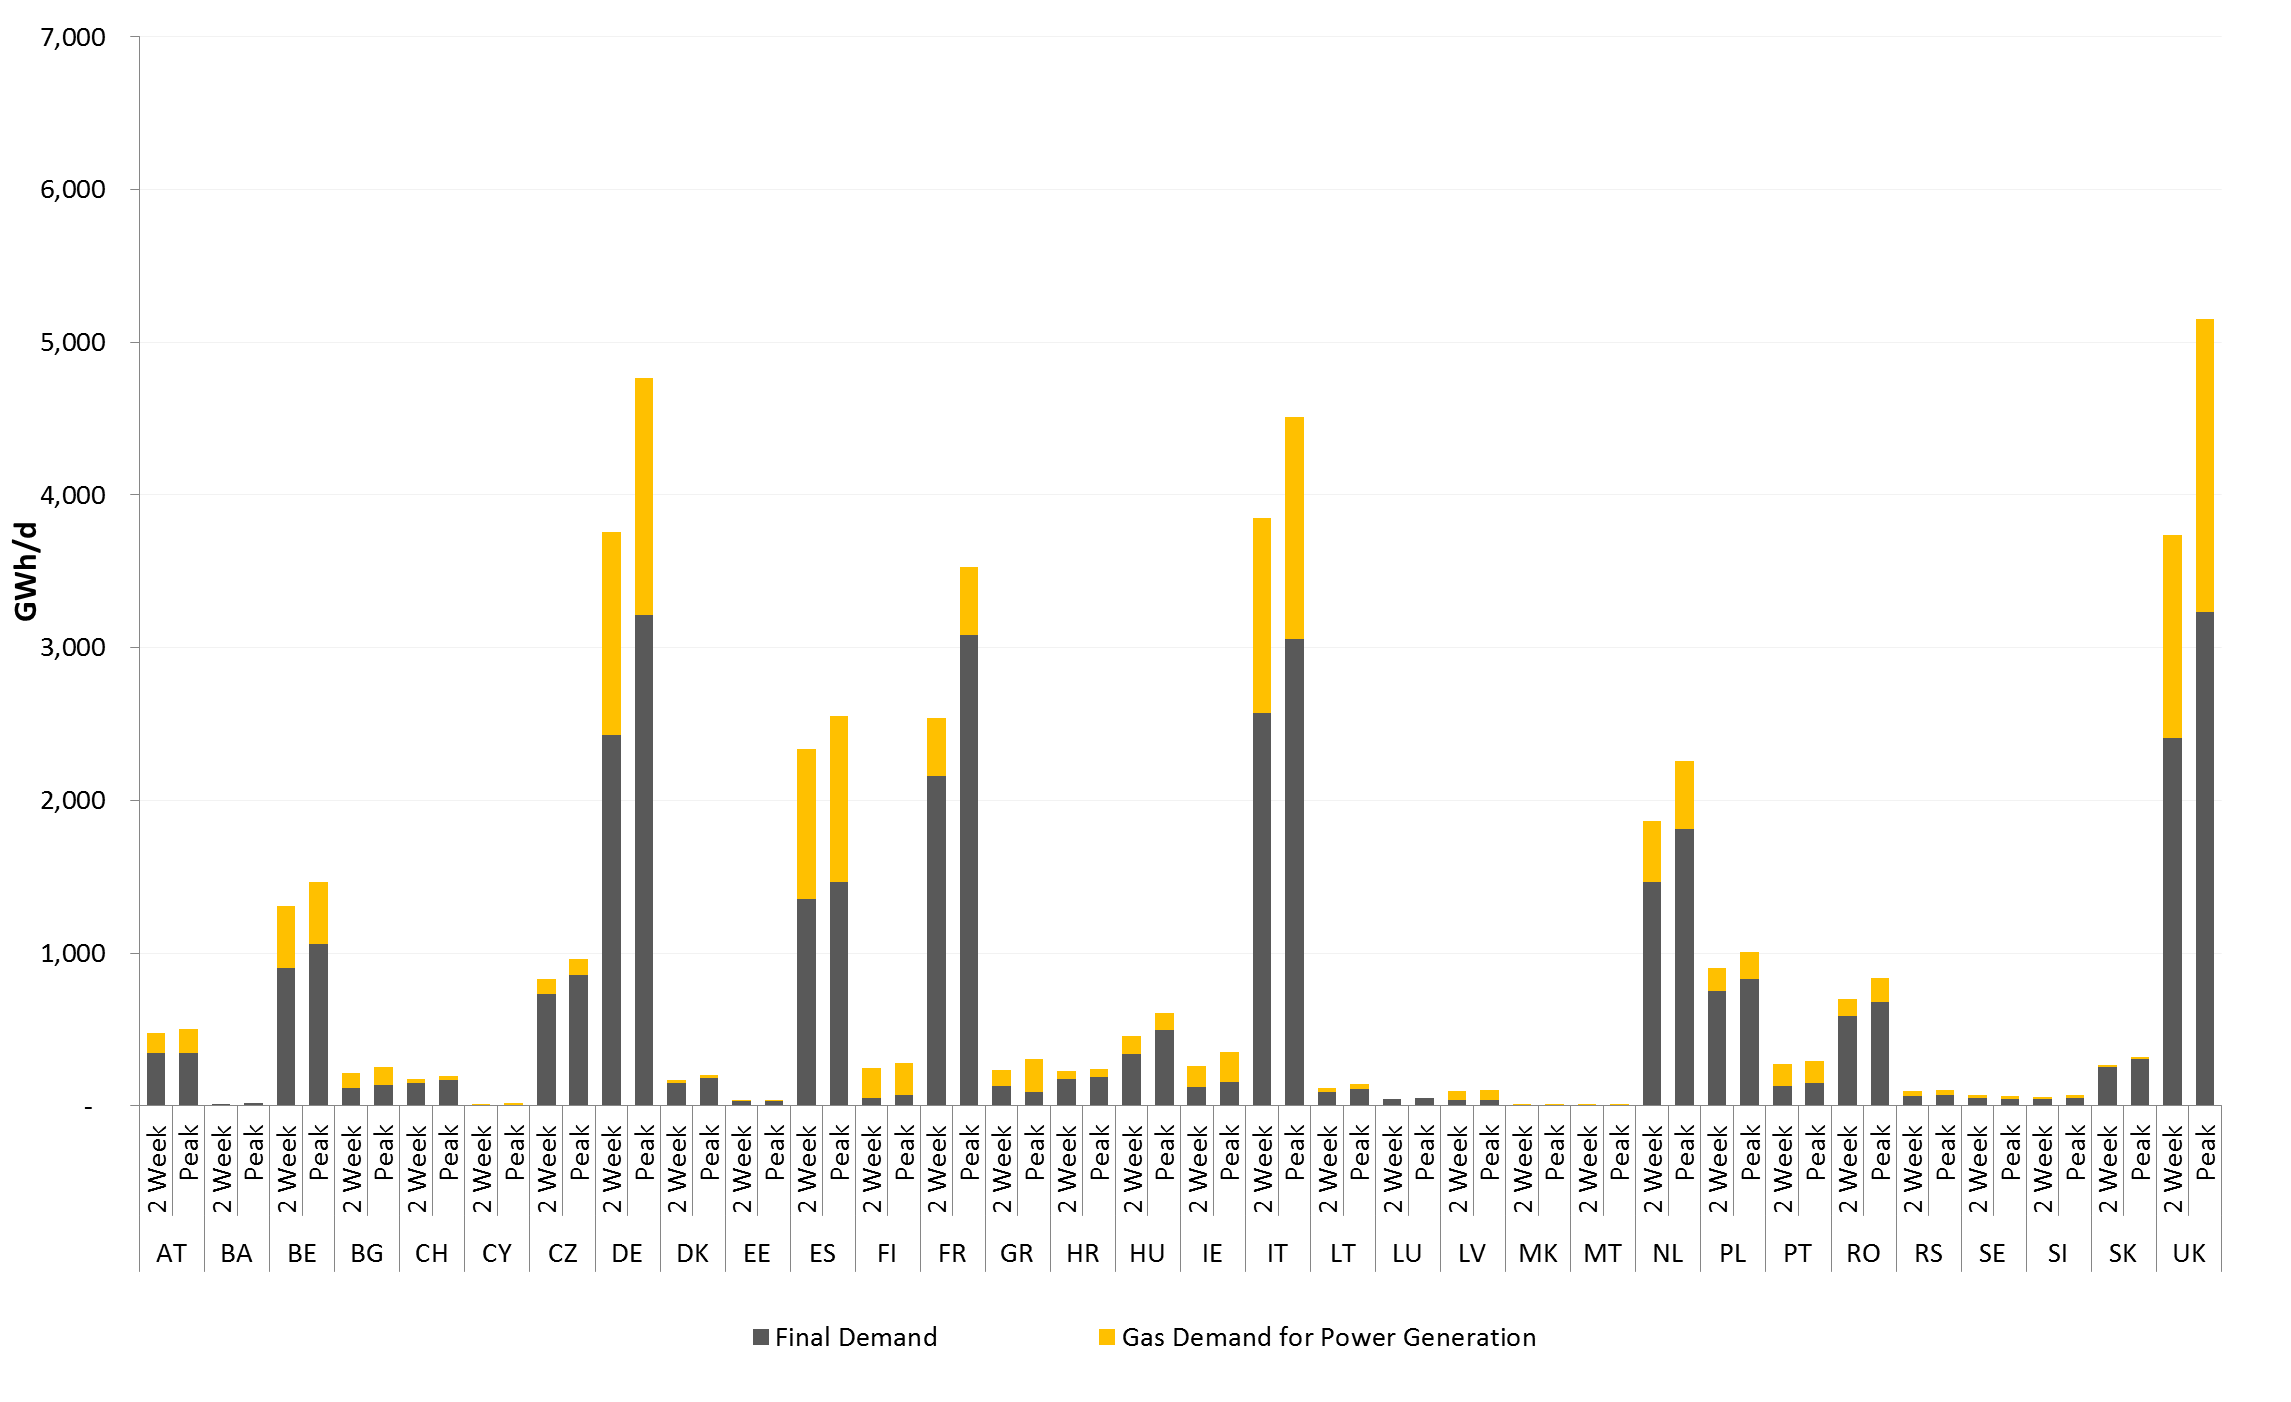
Figure 24: Gas high demand cases - 2040 Global Climate Action